200–400 km/h.
A high-performance comparison.
The current model projects 427.9 m from 400 km/h with powered underfloor suction, against a reference fitted to Bugatti's published 491 m figure. This is a potential 63.1 m / 12.9% reduction under assumed installed hardware maps.
It is a distance-equivalent simulation, not a measured CryoPulse result or a digital twin of a Bugatti.
Published stopping distances anchor every reference.
Bugatti's specification sheet supplies the Chiron distances below. A separate aggregate parameter is fitted at each starting speed; the prototype then adds an assumed 170 kg and the same assumed suction hardware. The new fan/tyre/seal effects are predictions.
| Speed to zero | Published Chiron distance | Conditional suction projection | Modeled reduction |
|---|---|---|---|
| 100 km/h | 31.4 m | 26.4 m | 5.0 m / 15.8% |
| 200 km/h | 114 m | 95.7 m | 18.3 m / 16.1% |
| 300 km/h | 247 m | 210.3 m | 36.7 m / 14.9% |
| 400 km/h | 491 m | 427.9 m | 63.1 m / 12.9% |
The reference and prototype both retain the shared air-brake envelope. No 16.4% low-speed body-CFD drag advantage is transferred to this high-speed calculation.
Bugatti technical specifications · Official 400 km/h braking record
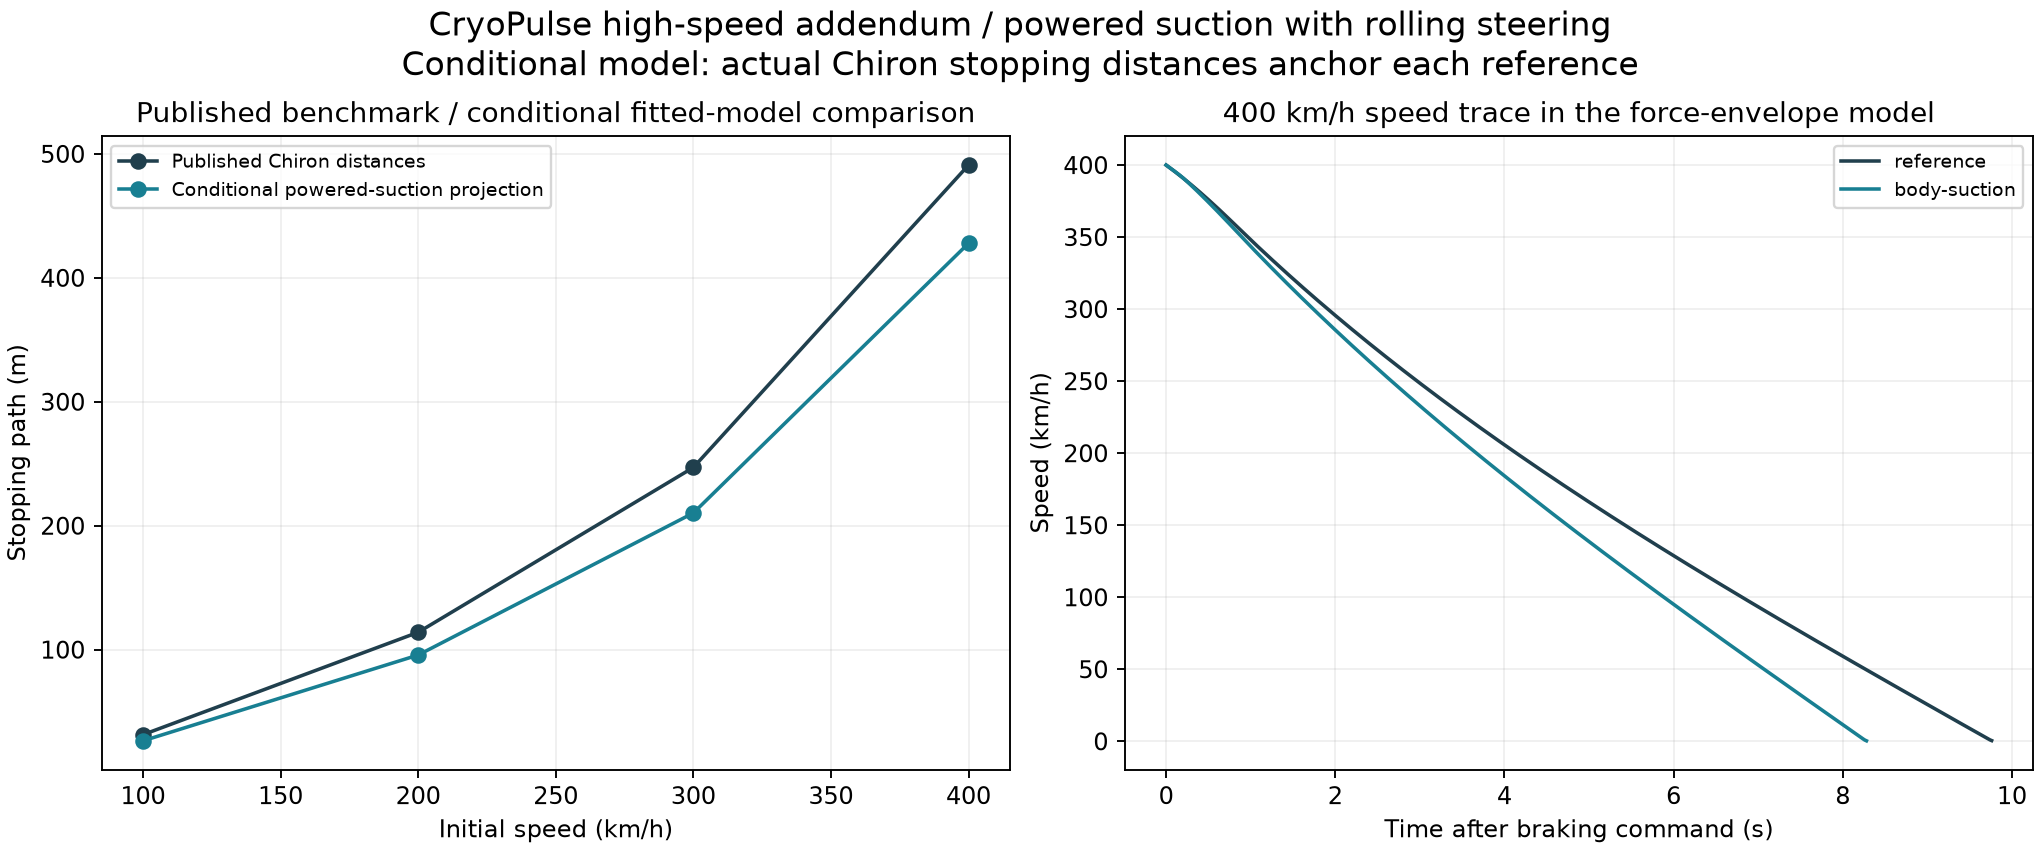
The right-hand speed traces are computed model histories, not recorded Bugatti telemetry.
Keep the existing high-performance brakes and air brake.
The reference includes the published Cd endpoints (0.36 in top-speed mode, 0.40 EB, 0.60 air brake) and the manufacturer's stated rear-downforce increase equivalent to approximately 900 kg at 400 km/h. The interpolation over 0.8 s and a 2.0 m² projected frontal area are assumptions, with an area sensitivity calculated separately.
The nominal model uses the published DIN empty mass of 1,995 kg. The actual record test mass is unknown. Axle loading, CG, inertia, tyre/brake characteristics and thermal state are not identified by the published distances.
| Starting speed | Published distance / fitted model | Fitted model stop time |
|---|---|---|
| 100 km/h | 31.4 / 31.400 m | 2.270 s |
| 200 km/h | 114 / 114.000 m | 4.195 s |
| 300 km/h | 247 / 247.000 m | 6.240 s |
| 400 km/h | 491 / 491.000 m | 9.770 s |
An independent check remains imperfect: the fitted 400 km/h reference takes 9.77 s, while Bugatti reports 9.3 s for its record stop. Matching distance does not reconstruct the real deceleration trace or validate the prototype gain.
The benefit depends on the installed pressure map.
| Effective seal gap | Assumed installed normal force | Assumed electrical power |
|---|---|---|
| 0.5 mm | 7718 N | 1569 W |
| 1 mm | 5815 N | 2055 W |
| 3 mm | 1615 N | 1216 W |
| 400 km/h case | Projected stopping path |
|---|---|
| Nominal 1 mm effective gap | 427.9 m |
| half-mm-effective-gap | 408.4 m |
| three-mm-effective-gap | 479.4 m |
| one-second-fan-delay | 438.9 m |
| two-second-fan-delay | 451.2 m |
| 340kg-hardware | 441.1 m |
| Fan unavailable, hardware mass retained | 503.3 m |
The nominal fan map supplies approximately 5.8 kN of added normal force at about 2.1 kW. An 8 kJ illustrative pre-spin allowance is also charged to the finite 100 kJ electrical store. Nominal total fan energy for the 400 km/h modeled stop is 24.6 kJ.
These are assumed source/installation maps. A measured tyre/brake torque or thermal ceiling can prevent additional normal force from producing the modeled extra braking.
Four times the speed means sixteen times the kinetic energy.
| 400 km/h energy/power screen | Reference model | Conditional prototype |
|---|---|---|
| Initial kinetic energy | 12.31 MJ | 13.36 MJ |
| Aerodynamic dissipation | 1.87 MJ | 1.66 MJ |
| Remaining brake/tyre dissipation | 10.45 MJ | 11.71 MJ |
| Peak brake/tyre power | 2.45 MW | 3.03 MW |
The prototype carries more kinetic energy and dissipates it faster in the nominal shorter stop. No disc temperature, pad temperature, cooling effectiveness, fade margin or real brake-torque reserve is established by these energy figures.
| Speed | Ambient dynamic pressure | Pressure for an illustrative ΔCp = 0.1 |
|---|---|---|
| 100 km/h | 463 Pa | 46 Pa |
| 200 km/h | 1852 Pa | 185 Pa |
| 300 km/h | 4167 Pa | 417 Pa |
| 400 km/h | 7407 Pa | 741 Pa |
At 400 km/h, ambient dynamic pressure is about 7.4 kPa, above the assumed 3 kPa fan stall head. This does not by itself prove failure or success: local underfloor pressure coefficients, road leakage and source/airflow coupling determine the installed result. Those need high-speed moving-ground analysis and tests.
Some high-speed cases still fail the control target.
| 400 km/h stress case | Mode | Path | Maximum path error | Example stability limits |
|---|---|---|---|---|
| 400-crosswind-pulse | reference | 502.4 m | 0.20 m | Pass |
| 400-crosswind-pulse | body-suction | 432.4 m | 0.10 m | Pass |
| 400-curve-0p4g-initial | reference | 705.5 m | 68.85 m | FAIL - not an improvement claim |
| 400-curve-0p4g-initial | body-suction | 577.9 m | 38.65 m | FAIL - not an improvement claim |
| 400-one-channel-loss | reference | 491.0 m | 0.00 m | Pass |
| 400-one-channel-loss | body-suction | 444.2 m | 0.00 m | Pass |
Both current models fail the initial 0.4 g curve case. Their shorter/longer paths are not evidence of a successful controlled curve stop. The common controller, initialization and vehicle model need further work for that case.
A useful high-speed hypothesis, with clear evidence gaps.
- Each starting-speed test has its own fitted aggregate parameter. These independent calibration points do not identify a common measured tyre, brake, fade or aero map, and are not independent model validation.
- The shared reference includes the published air-brake Cd and the stated rear-load increment. Frontal area, force location, deployment interpolation, CG and inertia are assumptions.
- Additional normal load is assumed to be exploitable by tyre/brake control. A real torque or thermal ceiling can remove that benefit; disc/pad/tyre temperatures and fade are not modelled.
- The assumed 170 kg installed mass, 1 mm effective seal gap, fan map and rapid pressure availability are not achieved hardware measurements.
- An 8 kJ rotor pre-spin allowance is charged against the 100 kJ store. It is an illustrative energy allowance; maintaining standby speed, motor peak power, inertia and valve operation remain unverified.
- At 400 km/h ambient dynamic pressure exceeds the assumed fan stall head. Vehicle-specific underfloor Cp, moving-road leakage, compressibility, wheel speed and flexible skirts require coupled high-speed analysis and tests.
- No 16.4% low-speed CFD drag benefit is transferred. Reference and prototype retain the same assumed external-airbrake map.
- The direct cold-only bench model does not supply this fan power. The high-speed gain is a powered-suction hypothesis, not proof of net cryogenic energy generation.
- The original high-speed road-wheel deployment concept is not credited. Tyres retain rolling steering contact in these comparisons.