Computational consistency
Conservation, common-store accounting, motion samples, metre-scale CAD imports and time-step checks pass.
 The concept ↗
P3.3 / COUPLED SYSTEM STUDY
Rear airflow. Upper vents. Shared power. Storage mass. Cold and heat. The next CryoPulse prototype brings their interactions into one numerical study.
Theoretical research · Unbuilt vehicle · Physical testing still to come
Download P3.3 prototype ↗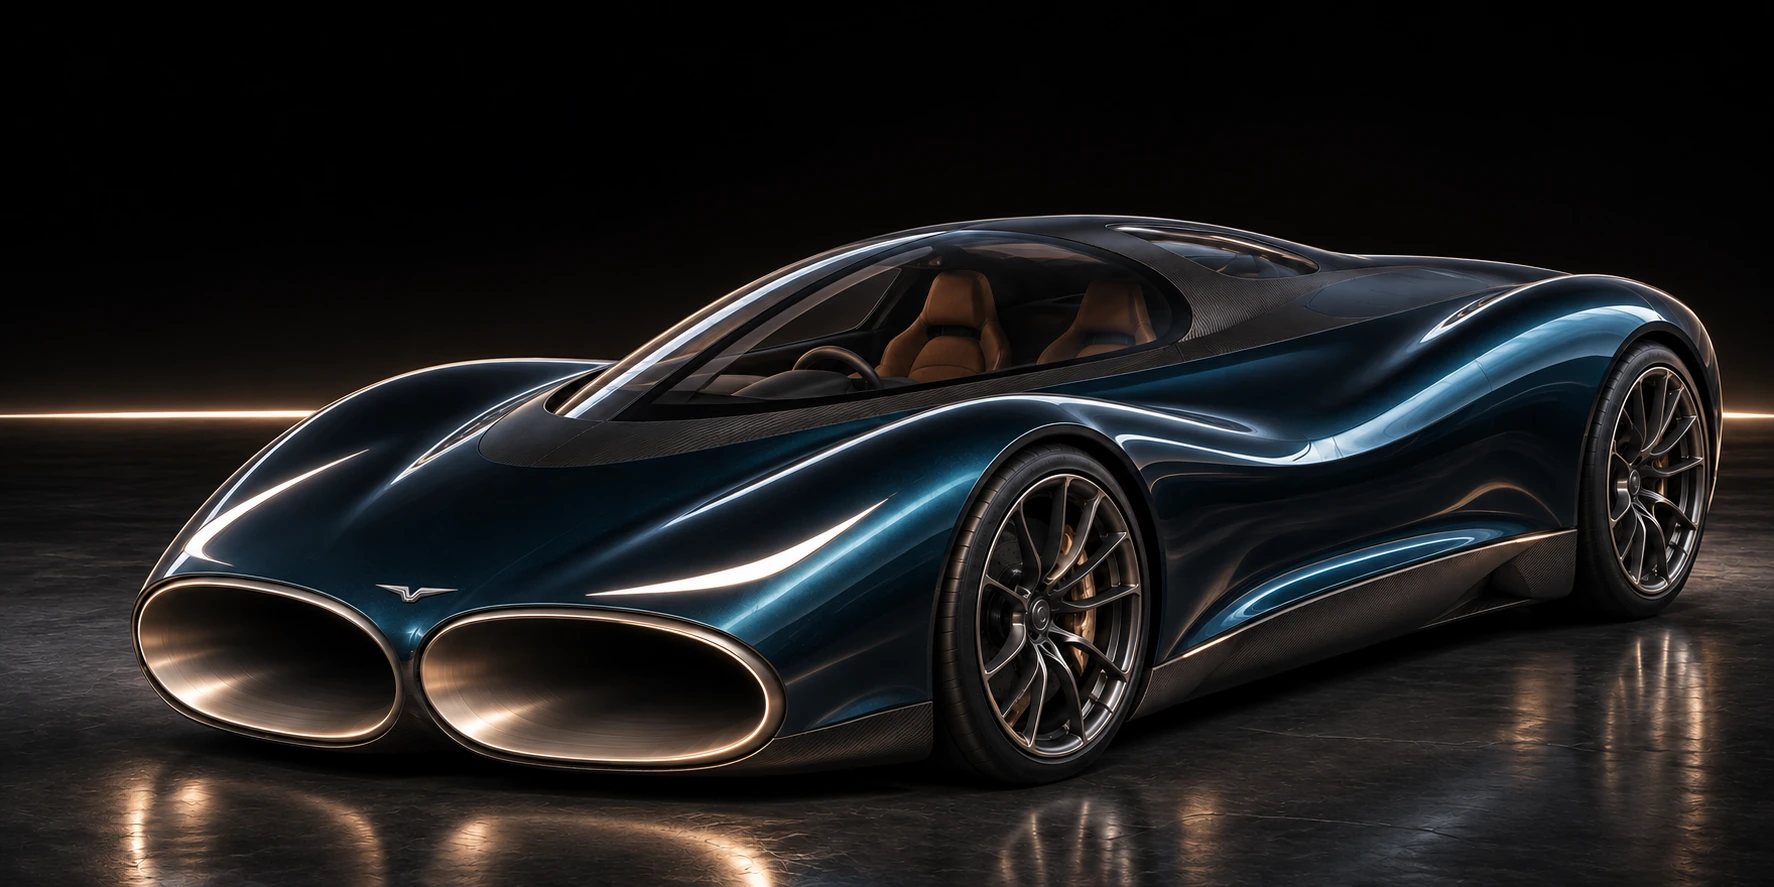
ONE VEHICLE / COMMON RESOURCES
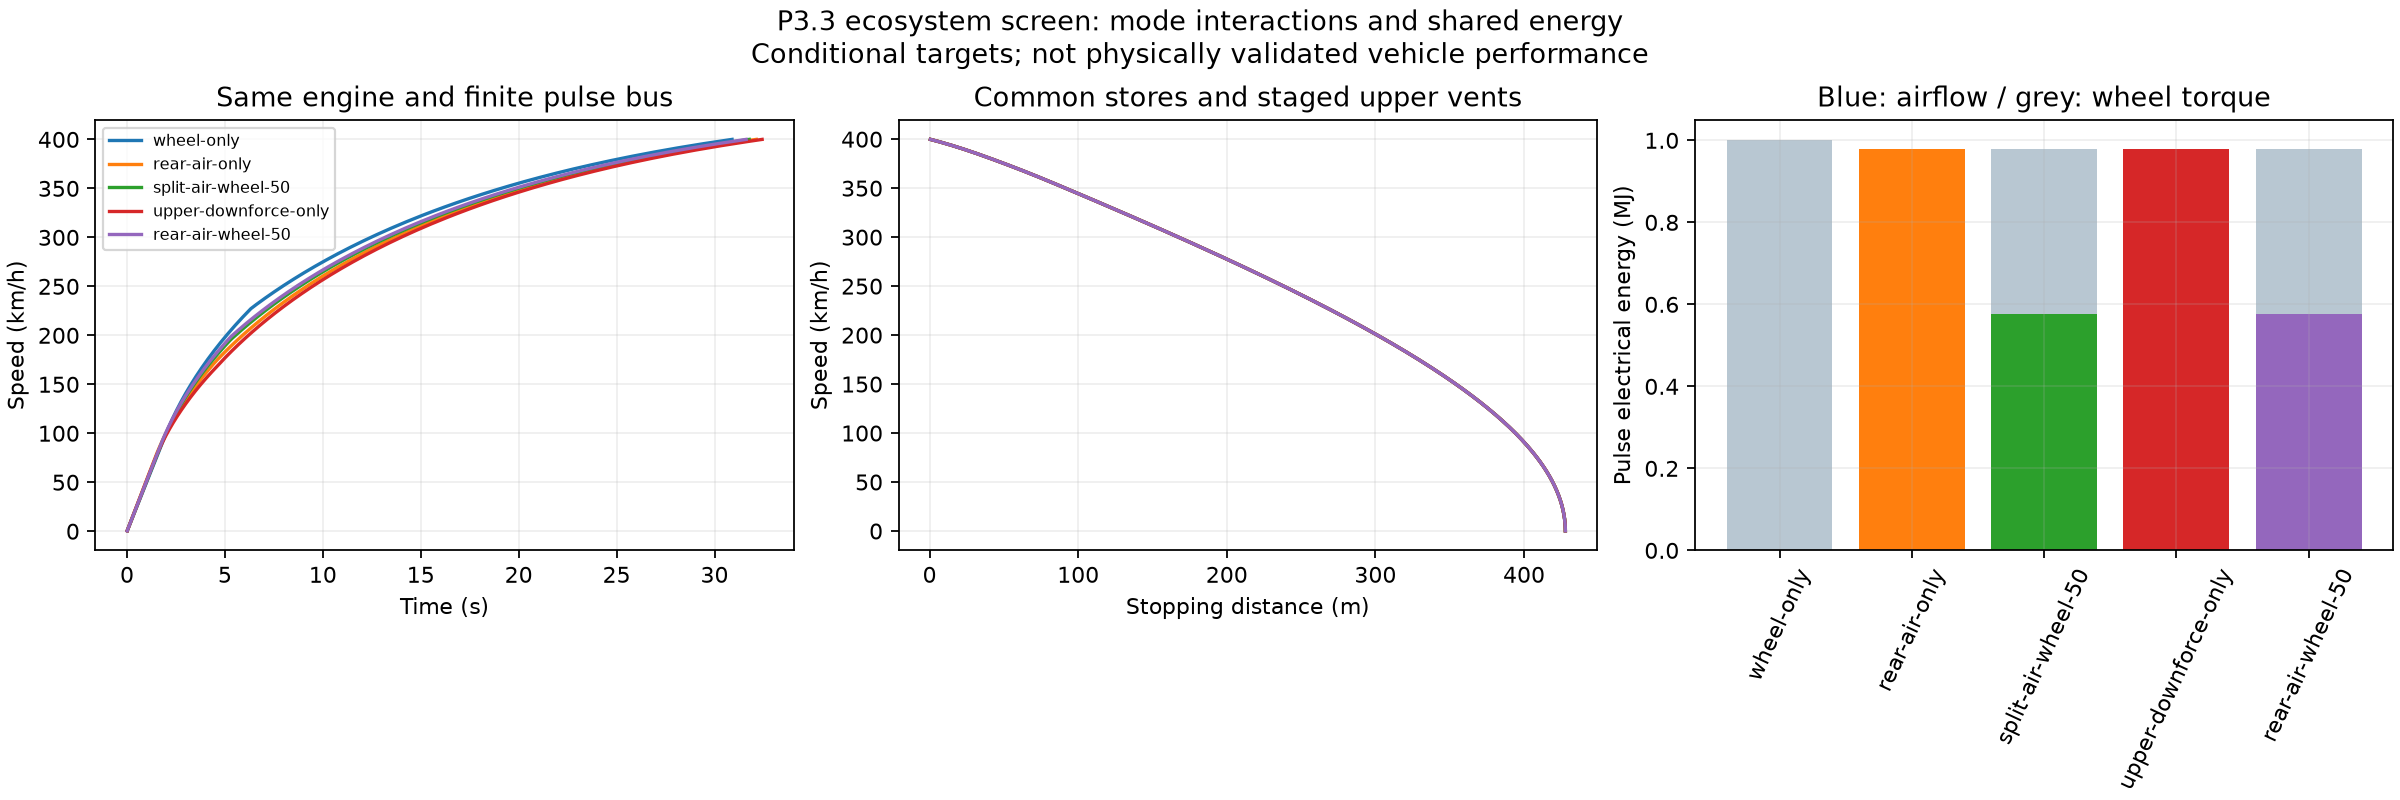
A shared rotor acts on one captured air stream. Rear and upper outlets divide that stream. A finite pulse store supplies the powered air system and wheel torque, while the auxiliary store supports grip, controls and door operation.
Instantaneous component-map screen. Shared pulse bus: 217.4 kW DC. Numerical maps use assumed losses; the arrows illustrate routing.
| 1 MJ / 2,225 kg target | 0–100 | 0–200 | 0–400 | 400–0 |
|---|---|---|---|---|
| Wheel pulse | 2.00 s | 5.08 s | 30.90 s | 427.8 m |
| Powered rear air | 1.99 s | 5.90 s | 32.13 s | 427.8 m |
| Rear + upper 30° / wheel split | 1.99 s | 5.54 s | 31.77 s | 427.8 m |
| Powered upper 90° | 2.05 s | 6.20 s | 32.43 s | 427.8 m |
| Rear air / wheel split | 1.97 s | 5.38 s | 31.61 s | 427.8 m |
All rows use the same fitted propulsion engine, 2,225 kg mass target, 200 kJ auxiliary store and 1 MJ pulse store. Electrical assistance adds power beyond the combustion engine. Powered-air cases also debit an assumed 20 kJ rotor preparation cost.
The external CdA target is 0.57 m², including an unachieved 0.15 m² improvement before duct forces. Fan, seal, tyre and 3 MW wheel-brake assumptions remain unvalidated. The reference acceleration fit has a roughly 7.9% held-out discrepancy.
| Fresh reserved 1 MJ event | Engine only | Finite pulse peak |
|---|---|---|
| Wheel pulse | 446.5 km/h | 456.9 km/h |
| Powered rear air | 446.5 km/h | 449.4 km/h |
| Rear air / wheel split | 446.5 km/h | 453.1 km/h |
| Rear + upper 30° / wheel split | 446.5 km/h | 446.7 km/h |
Powered rear airflow raises the predicted speed above the engine-only case. The upper outlets trade forward momentum for downward reaction. For this model and pulse budget, sending electrical power to the wheels produces the higher speed peak.
These are separate events starting at the modelled engine-only equilibrium with a fresh reserved 1 MJ. They do not spend the acceleration pulse twice. The reference power envelope gives about 431 km/h engine-only; it is not a measured unrestricted Chiron speed. Above 400 km/h, the fitted engine curve is extrapolated. Gearing, tyres, cooling and stability remain unresolved.
STORAGE / MASS / HEAT
A longer electrical pulse changes the performance case. The new screen adds an estimated 199 kg pack to the earlier mass allowance, without subtracting an undocumented previous storage mass.
| Usable DC window | Vehicle mass | 0–400 | 400–0 | 0–400–0 |
|---|---|---|---|---|
| 1 MJ | 2424 kg | 33.96 s | 446.6 m | 42.62 s |
| 4 MJ | 2424 kg | 27.36 s | 446.6 m | 36.02 s |
| 8 MJ | 2424 kg | 23.99 s | 446.6 m | 32.65 s |
The base engine and 200 kW wheel-pulse ceiling stay the same. The published Chiron benchmarks are 32.6 s to 400 km/h, 491 m to stop, and 41.96 s for 0–400–0. These CryoPulse values are conditional model outputs.
The cell screen uses published Molicel P50B nominal energy, energy density, current and cycling information, with an assumed 35% pack overhead and conservative voltage/resistance envelope. It is a mass and heat calculation, not a qualified battery pack. Manufacturer reference ↗
| Equal mass / 8 MJ / same engine | 0–100 | 0–400 | 400–0 |
|---|---|---|---|
| Matched mass and pulse / no added air system | 2.47 s | 25.73 s | 525.3 m |
| Airflow and grip / no external shape credit | 2.06 s | 27.13 s | 446.6 m |
| Airflow and grip / target external shape | 2.06 s | 23.99 s | 446.6 m |
These controls carry the same mass and 8 MJ window. Removing the added airflow hardware improves high-speed acceleration in this model, while the powered-grip and upward-duct case improves launch and stopping. The target external shape is needed for the stronger all-round result.
The no-air row is a numerical control, not a tested hybrid Chiron. The cruise drag-area sweep is relative to an assumed reference; it does not validate the actual CAD drag. The same braking aero envelope, tyre law and wheel-brake ceiling are held fixed.
| External CdA | Assumed duct K | 0–400 | 400–0 |
|---|---|---|---|
| 0.57 m² | 0.5 | 23.99 s | 446.6 m |
| 0.62 m² | 0.5 | 24.89 s | 446.6 m |
| 0.67 m² | 0.5 | 25.92 s | 446.6 m |
| 0.72 m² | 0.5 | 27.13 s | 446.6 m |
| 0.57 m² | 0.8 | 24.15 s | 447.6 m |
| 0.62 m² | 0.8 | 25.07 s | 447.6 m |
| 0.67 m² | 0.8 | 26.13 s | 447.6 m |
| 0.72 m² | 0.8 | 27.38 s | 447.6 m |
| 0.57 m² | 1.2 | 24.22 s | 448.5 m |
| 0.62 m² | 1.2 | 25.15 s | 448.5 m |
| 0.67 m² | 1.2 | 26.23 s | 448.5 m |
| 0.72 m² | 1.2 | 27.49 s | 448.5 m |
The K values are high-speed assumptions for sensitivity analysis. They are not transferred measured coefficients from the low-speed CFD.
The 8 MJ-window case reaches 400 km/h in about 24.0 s in this model. Its actual pulse use produces about 1.35 MJ of incremental cell and motor heat in the screening envelope. Allocating that heat across the existing nitrogen path would require about 2.62 kg, if the required temperature approaches can be achieved.
The cells stay in a controlled warm operating band. A separate thermal loop can move excess heat to the cold service. Cryogenic shaft opportunity is recorded separately; it is not credited again as free vehicle power.
Inspect the storage, heat and nitrogen ledger ↗ACTUAL MECHANISM CAD
The new bench module has two opening upper covers and a rear butterfly. The intended sequence opens the upper route before closing the rear route, while keeping an available discharge path.
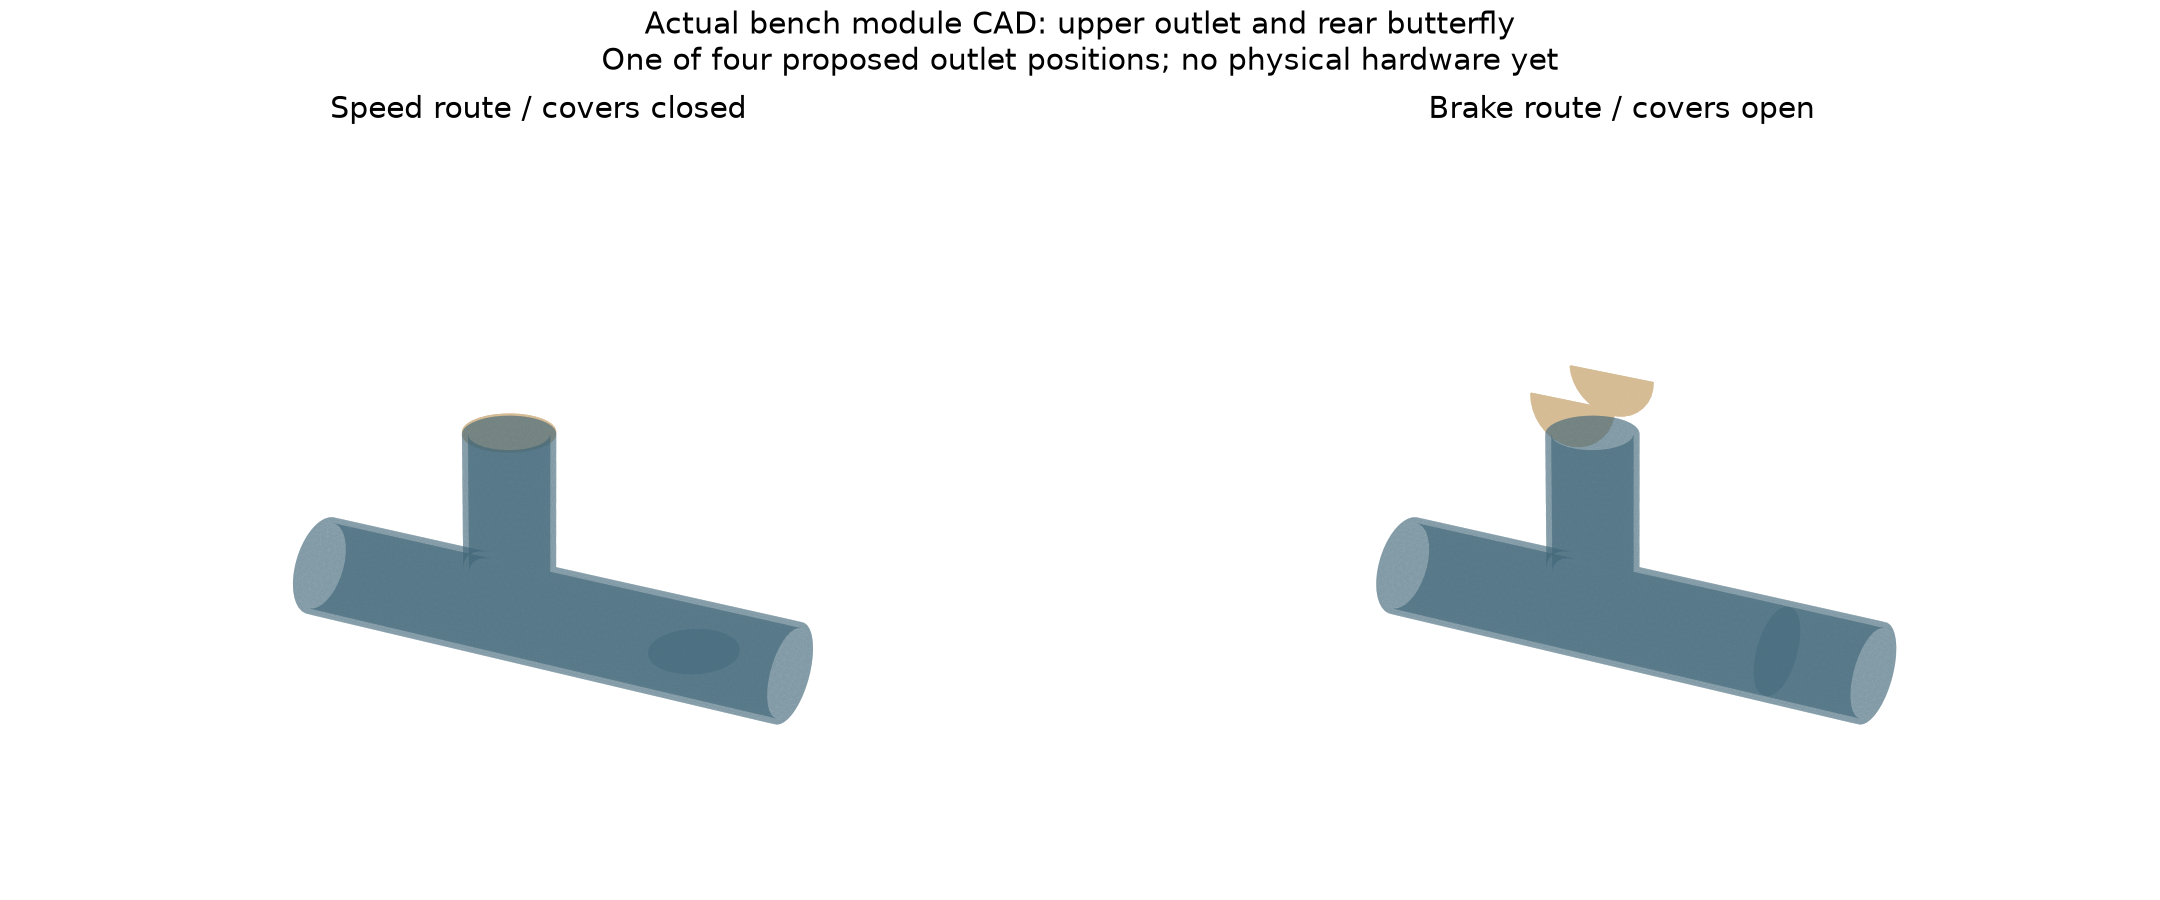
Nine CAD poses pass the sampled interference checks. The paper interlocks cover ordinary switching, a stuck upper cover, power loss and a parked open door. The four-port cover-load screen adds a 263 J electrical motion allowance to the same auxiliary energy ledger.
These checks do not qualify a hinge, seal, spring, actuator or road-vehicle controller. The CAD module is for a low-pressure bench demonstration. Actual sensors, jammed-rear behaviour and passive relief still need hardware tests.
COLD-FLOW DEMONSTRATION
The new channel model makes cooling surface and pressure loss follow the same geometry. The selected dry-air bench case predicts about 5.0% more mass flow through the cooled core than through the same warm core at matched head.
Cooling increases density and lowers dynamic viscosity in this model. In the fully cooled viscous limit, mass flow at the same pressure head scales with density divided by viscosity. The 293-to-273 K limit is about 13.4%; the complete selected core gives about 5% after its other losses are included.
The test measures the matched-core change, the reduction versus bypass, the heat drawn and the complete source power together. The predicted cold-flow effect does not establish an overall vehicle or net-energy benefit.
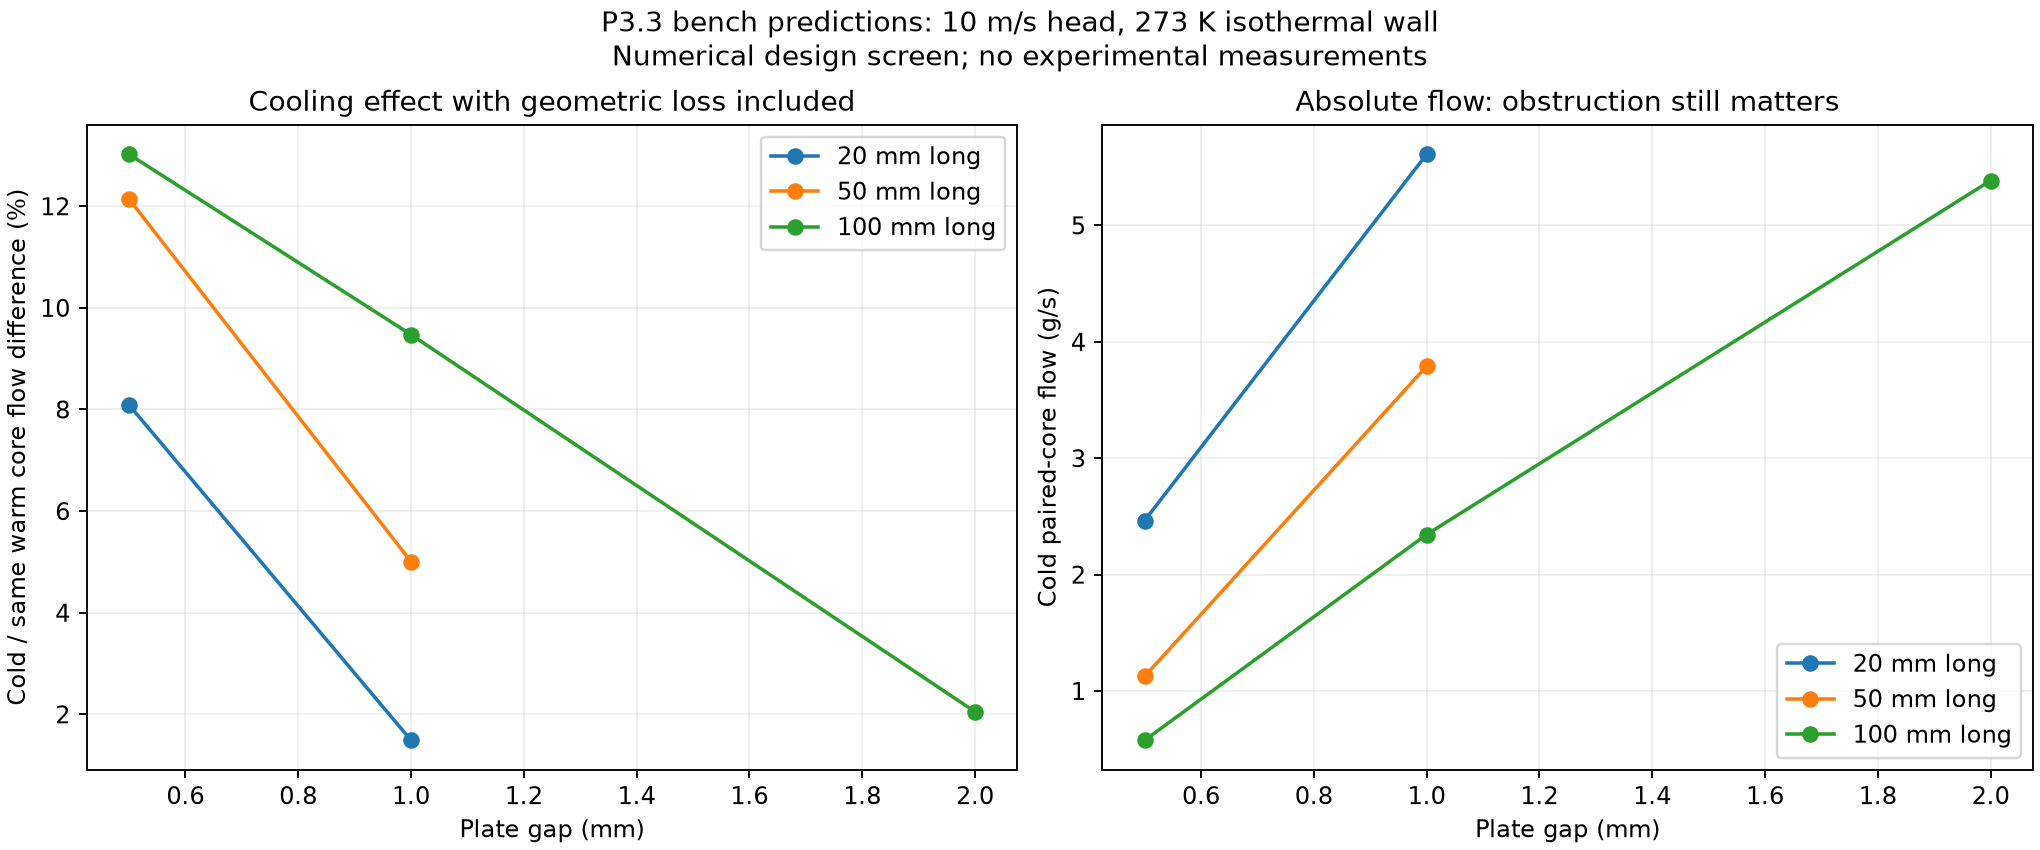
The first rig is pressure-fed: a regulated plenum drives the duct at about 60 Pa, with dry air, a 3 litre ice-water bath, calibrated flow and pressure instruments, and at least six randomised warm/cold pairs. No experimental data have been invented.
EVIDENCE / OPEN VALIDATION RECORD
Five new free-air CFD cases compare the revised through-flow body, a blocked-intake control and the earlier duct law. The open-body drag trend persists between two meshes, while the numerical evidence gate remains open.
| Mesh | Open total drag | Blocked total drag | Difference |
|---|---|---|---|
| L4 | 0.5849 N | 0.6049 N | 3.3% lower |
| L5 | 0.6019 N | 0.6261 N | 3.9% lower |
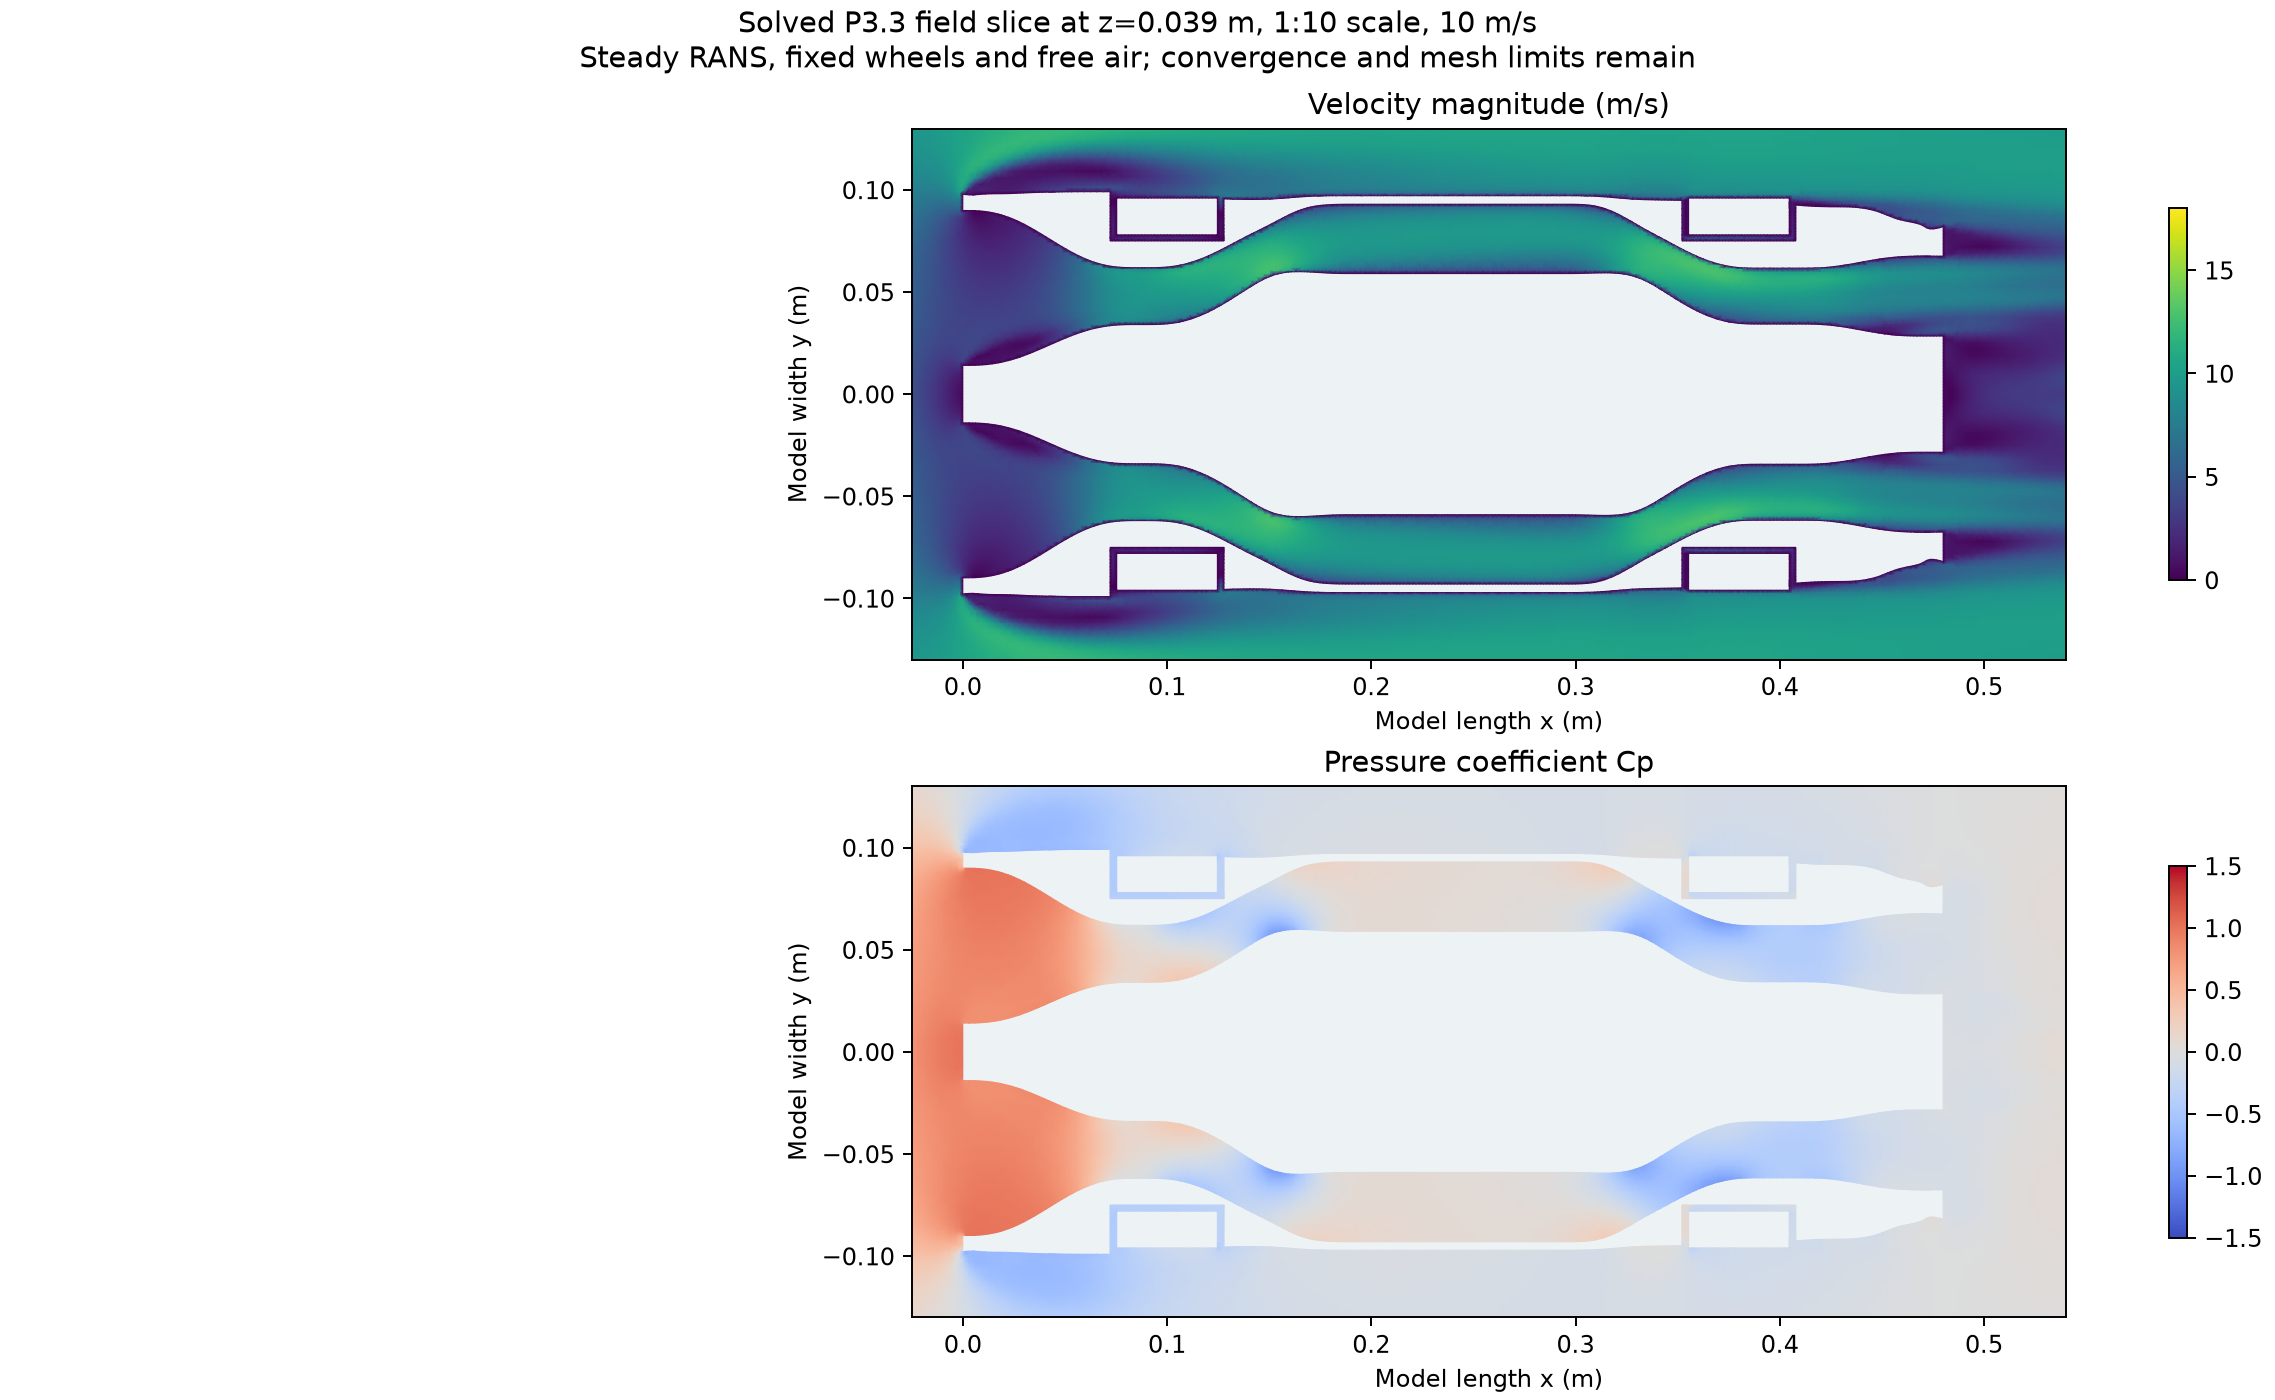
The last-window blocked L5 drag drift is about 3.1%, comparable with the paired drag difference. Strict residual and extended mesh checks also remain unresolved. These results are retained as preliminary; they are not used to validate the assumed high-speed CdA improvement.
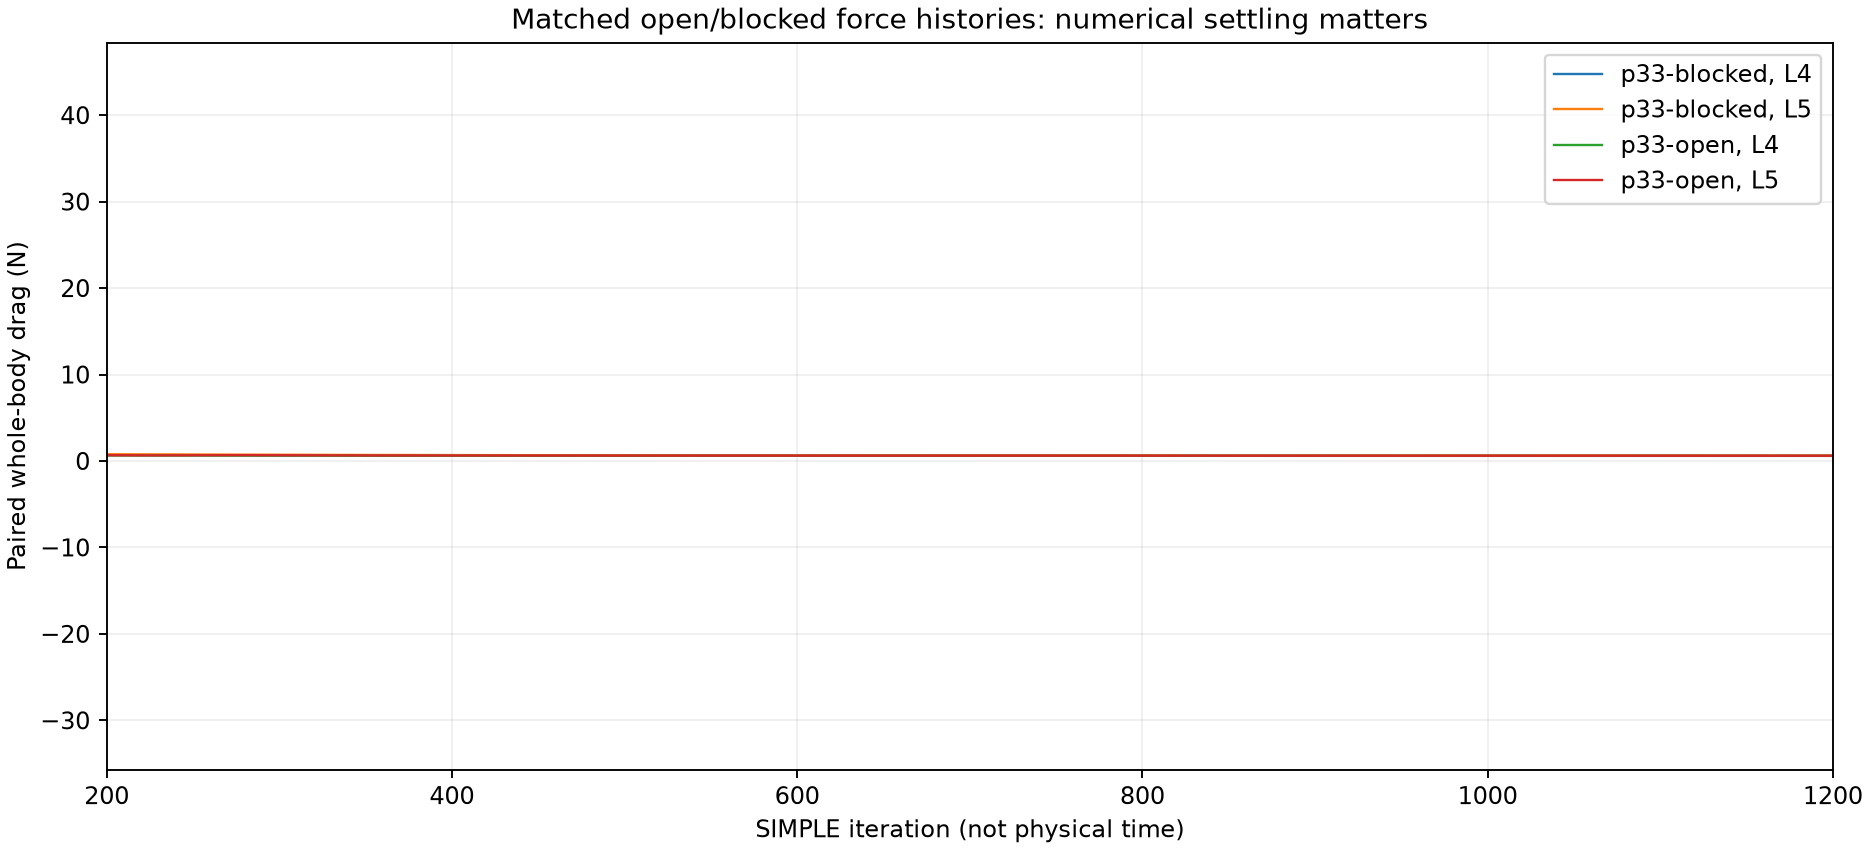
Conservation, common-store accounting, motion samples, metre-scale CAD imports and time-step checks pass.
The wake, pressure residuals, concave mesh cells and reconstructed duct-flux variation need better resolution.
The bench, installed component maps, real seals, tyre response and vehicle tests have not been performed.
THE NEXT DESIGN STAGE
Build the pressure-fed cold-flow and moving-vent demonstrations. Measure mass flow, loss, force, power, leakage and temperature. Replace assumed component maps with those measurements.
Improve mesh quality and use a time-resolved calculation before a moving-road, rotating-wheel, high-speed study of the same geometry with working upper vents.
Develop the contoured covers, structural body, suspension, seals, thermal loops, mass budget and human access. The luxury styling must be reconciled with the engineering surfaces.
Extend the shared-resource model to axle loads, pitch and yaw, weather/grip estimation, steering and heat fade. Straight-line stopping alone does not establish trajectory stability.
The wider twelve-part CryoPulse programme remains unfinished. Further theoretical and physical testing is still to come.
The calculations and their interpretations are CryoPulse research. None of the named organisations endorses or validates this concept.