P5.0 / ENGINEERING SPECIAL
Two traction drives.
One connected system.
Keep the engine. Add a second electrical path. Give the heat-recovery stage two carefully timed windows.
Physical vehicle measurements: 0
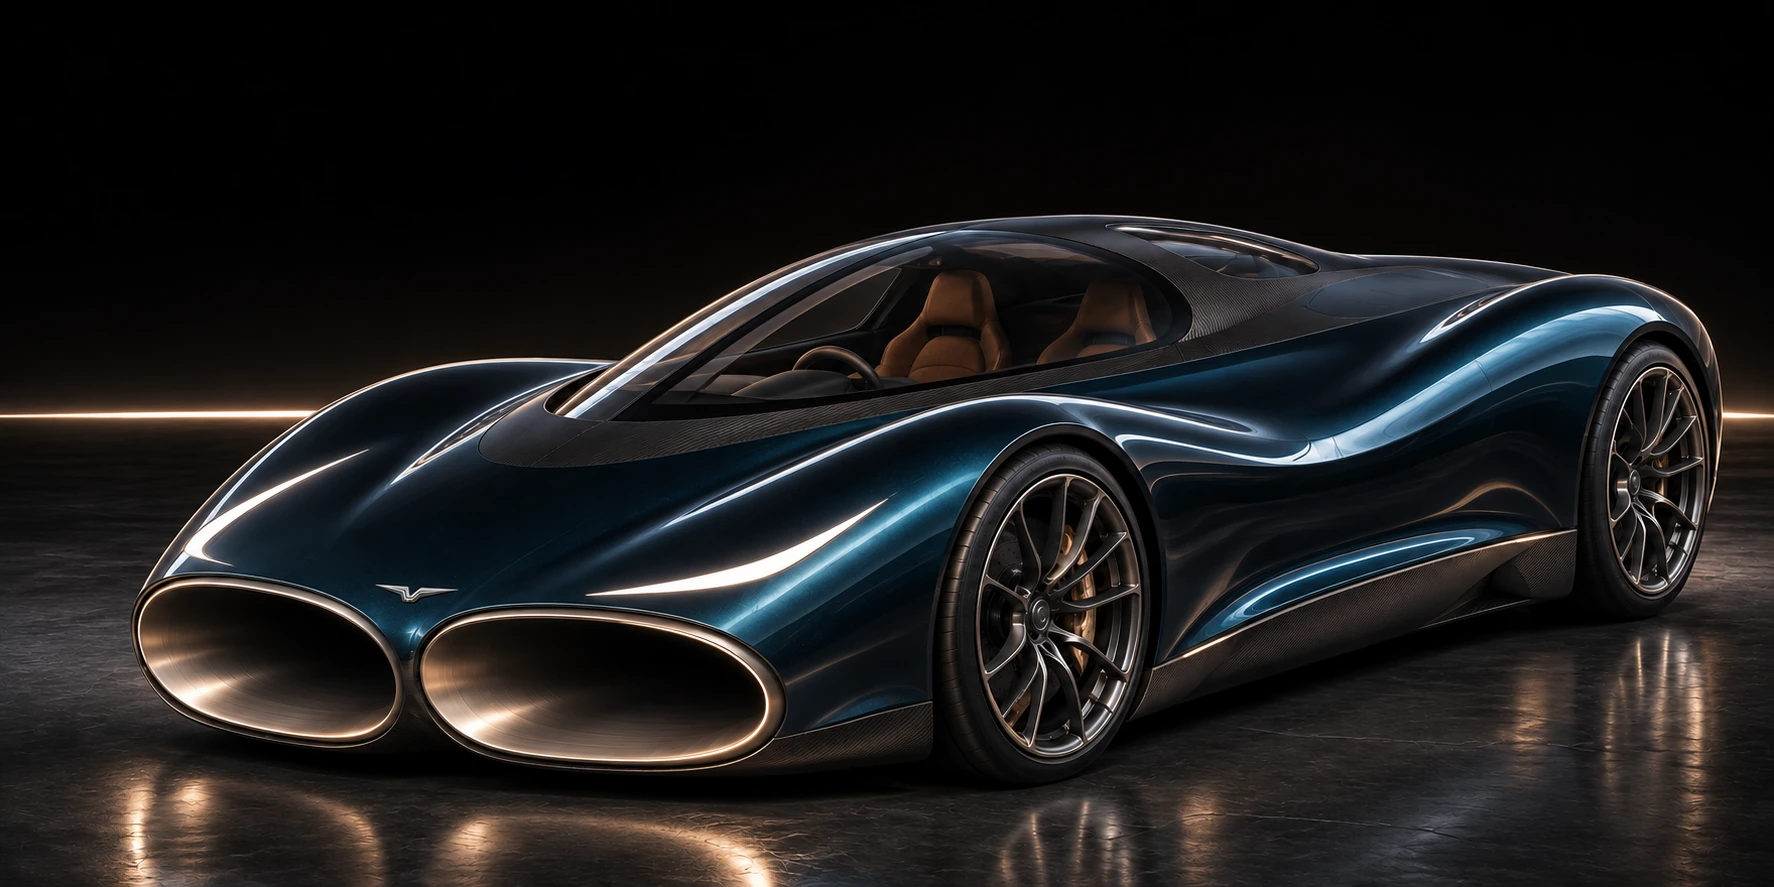
One hardware configuration. The immediate 400–0 stop and the speed event branch from its same saved launch state. Neither receives fresh energy at 400 km/h. The stopping figure is not a stop after the peak-speed run.
WHAT CHANGED
Make the extra hardware
earn its place.
The first paired-drive setup still had the earlier 310 kW launch cap. Correcting the allocation let both drives use the declared larger bus, while cell voltage, current and motor-map limits continued to apply.
Using all the nitrogen early helped the sprint but reduced the later peak. The selected policy spends a small part early, closes the valve, and uses the remaining inventory later. Reopening pays the modeled acceptance delay.
The earlier, lighter P4.6 model remains a separate option: 2.01 s to 100 km/h and a 441.6 m stop from 400 km/h. This heavier version gives up some launch and braking performance while developing the higher-speed event. Its mass, duct-loss assumptions and dispatch policy have changed; the comparison does not isolate one component.
EngineSame fitted effective power curve
Electrical tractionTwo iM-375 source-derived envelopes
Battery216-series / 18-parallel P50B cells
Whole wet mass3,509.4 kg
Early nitrogen target1.5 kg before 200 km/h
Late nitrogen windowFrom 470 km/h
THE SAVED SPEED EVENT
Follow the power.
Speed0 km/h
Electrical wheel work rate0 kW
Recovered shaft power0 kW
Usable nitrogen left0 kg
Prepared event: six-minute engine warm-up plus six-second floor preparation, with fuel and electrical costs included. No nitrogen is expanded while stationary. The curve and readings are a numerical replay.
WHERE IT FITS
Keep the roof clear.
Keep the doors usable.
The additional pack reserve sits above the engine allocation. The second drive reserve sits behind it. The native geometry checks 15 component clearances, 171 component pairs, wheel travel, door motion, body containment and the sealed passages.
The manufacturer drawing supplies a module bounding envelope. The 125 kg allowance per drive includes a budget beyond the drawn module. Couplings, coolant routing, heat shielding, module details and crash structure remain to be engineered.
MEASURED RECORDS / CONDITIONAL MODEL
The benchmark stays clear.
FIA-recognised measured single-direction achievement.
Published measured high-speed record run.
Conditional temporary simulated peak. Vehicle not built.
The acceleration and 491 m stopping reference belongs to the original Chiron. It is separate from the Super Sport 300+ speed benchmark. Different test conditions and a simulation are not directly equivalent evidence.
COMPLETED NUMERICAL CHECKS
Repeat it. Challenge it.
All 13 dispatch screens pass their stated numerical gates. The figures above use the finer, half-step repeat of the selected configuration. Its nine road/fault cases use the nominal step, with the same controller and saved launch.
Half-step differences: -0.83 ms to 400 km/h, +0.820 m stopping distance, and -0.0170 km/h peak speed.
Compare all 13 nominal-step dispatch configurations
The selected row is the nominal-step screen. Headline figures use its finer repeat; the stopping difference is reported above.
| Configuration | Wet mass | 0–200 | 0–400 | 400–0 | Temporary peak |
|---|---|---|---|---|---|
| paired-reserve-regression | 3,509 kg | 6.248 s | 25.91 s | 485.9 m | 505.16 km/h |
| split-q050-r20-l470 | 3,509 kg | 6.100 s | 26.33 s | 484.5 m | 506.61 km/h |
| split-q100-r20-l470 | 3,509 kg | 5.967 s | 26.17 s | 484.5 m | 506.74 km/h |
| split-q150-r20-l470 | 3,509 kg | 5.837 s | 26.02 s | 484.5 m | 506.83 km/h |
| split-q050-r22-l470 | 3,509 kg | 6.100 s | 25.90 s | 487.7 m | 505.59 km/h |
| split-q100-r22-l470 | 3,509 kg | 5.967 s | 25.75 s | 487.7 m | 505.72 km/h |
| split-q150-r22-l470 | 3,509 kg | 5.837 s | 25.61 s | 487.7 m | 505.81 km/h |
| split-q050-r24-l470 | 3,509 kg | 6.100 s | 25.75 s | 485.9 m | 505.24 km/h |
| split-q100-r24-l470 | 3,509 kg | 5.967 s | 25.61 s | 485.9 m | 505.40 km/h |
| split-q150-r24-l470 | 3,509 kg | 5.837 s | 25.47 s | 485.9 m | 505.51 km/h |
| split-q050-r20-l440 | 3,509 kg | 6.100 s | 26.33 s | 484.5 m | 506.77 km/h |
| split-q050-r20-l450 | 3,509 kg | 6.100 s | 26.33 s | 484.5 m | 507.66 km/h |
| split-q050-r20-l460 | 3,509 kg | 6.100 s | 26.33 s | 484.5 m | 507.65 km/h |
THE REFILL QUESTION / P5.1–P5.2
Make the supply
part of the design.
The cold inventory has to come from somewhere. One route is to separate nitrogen from air and liquefy it at the workshop. Another is to reserve the recovery stage for the occasions that need it.
01 / AIRSeparateNitrogen gas from air
→02 / ELECTRICITYLiquefyPowered refrigeration
→03 / WORKSHOPStorePrepared liquid inventory
→04 / VEHICLERecoverFinite heat-to-shaft work
FOUR SAVED SIMULATIONS
How much does the
extra pulse earn?
Choose a completed run. The hardware, wet mass and aerodynamic targets stay the same.
Temporary simulated peak km/h
- Nitrogen expanded
- 10.0 kg
- 0–400 km/h
- 26.02 s
Conditional numerical screen
Physical measurements: 0
EXISTING STATIONARY EQUIPMENT
Air in. Liquid out.
Between runs.
Noblegen lists a Triton LN20 generator at 20 litres per day, with 3.2 kW listed electrical consumption and a 352 kg enclosure. It shows that workshop production is possible. It is not a selected vehicle component or a verified operating-cost estimate.
Manufacturer specifications ↗WHAT THESE SCREENS ESTABLISH
The recovery stage can be bypassed in the model without losing all electrical assistance. Whether that becomes a practical everyday mode needs an empty-tank, cooling and controls study.
Gas separation alone does not provide the liquid. Liquefaction needs electrical work and heat rejection; onboard production receives no credit in these results. Purity, pressure, transfer losses, installation and cost still need a supplier-specific assessment.
These nominal-step screens keep the original 20 kg starting inventory and full wet mass. The displayed expanded quantities exclude the 2 kg preparation allowance, hold-up, standing and transfer losses. The off case removes cryogenic preparation but assumes the same full-power engine curve. It does not validate an empty-tank vehicle or a cold-engine launch. The main P5.0 scorecard uses a finer time step.
WHAT THE MODEL STILL ASSUMES
The next evidence is physical
and aerodynamic.
The 0.65 m² body drag-area target and K=1.5 duct-loss screen are unqualified. The new duct grids have not converged. The fitted engine curve is extrapolated above 400 km/h; installed drive and thermal maps, tyres and high-speed stability remain unvalidated. Numerical agreement tests the calculation under these assumptions.
The wider vehicle still needs detailed structural, cooling, pressure, brake, suspension, impact and occupant engineering. No production-car record or physical performance advantage is claimed.
Could the nitrogen come from air?
Nitrogen gas can be separated from air. Making the liquid cold inventory additionally needs refrigeration, compression and power. Onboard production and a sealed gas heat-recovery loop are further studies; neither receives a performance credit here. Air separation and liquid nitrogen ↗
OPEN THE WORK
CAD. Code. Complete traces.
Download the scientific package ↗SHA256: 7fd2cf48d11a30d7b3af90190930a4e7a6b3cfa688e9bea9747e758e0913bbe4