
0–400 km/h after six minutes of modelled stationary warm-up and six seconds of floor preparation.
P4.7 / OPERATING POLICY AND ENERGY
Less preparation.
More useful work.
The performance model is live. The next question is how much energy its gains cost—and which operating policy makes better use of the same car.
Conditional numerical study. Physical measurements: 0.
0–400 km/h with no stationary engine warm-up. The same six-second floor preparation remains. Recovery comes in as engine heat becomes available during acceleration.
The cold-start mode takes 0.96 s longer to reach 400 km/h. Its early acceleration is also slower. The car, maximum wet mass, fitted engine curve and traction-current envelope remain the same.
THE COMPLETE LAUNCH AND STOP
Same endpoints.
The whole bill.
These three events start at rest and finish stopped after reaching 400 km/h. Battery, coolant, nitrogen and rotor states carry into braking. The energy comparison includes that braking phase; neither the battery nor the cold inventory is reset at 400.
Supply and recharge values are scenarios. No actual CryoPulse liquefier, delivery chain or charging test has been measured.
Fuel energyRecharge electricityNitrogen-production electricity
The sum is an unweighted site-energy screen. It is not fuel economy, emissions, exergy efficiency or a measured road-cycle result. Delivery, long-term storage, manufacturing and air-separation adders are excluded.
| Mode | Warm-up | 0–100 | 0–200 | 0–400 | 400–0 | 0–400–0 |
|---|---|---|---|---|---|---|
| Prepared performance mode | 360 s | 2.01 s | 5.83 s | 27.39 s | 441.6 m | 34.63 s |
| Cold-start recovery mode | 0 s | 2.14 s | 6.80 s | 28.34 s | 440.8 m | 35.57 s |
| Cold-start bypass | 0 s | 2.13 s | 6.79 s | 32.16 s | 440.8 m | 39.39 s |
Distances exclude driver reaction. The cold-start recovery mode completes its full launch and stop in 35.57 s in the dry nominal model. These operating comparisons do not replace the prepared performance headline or the separate speed-reserve event.
THE PREPARATION SWEEP / SPRINT ONLY
What each minute buys.
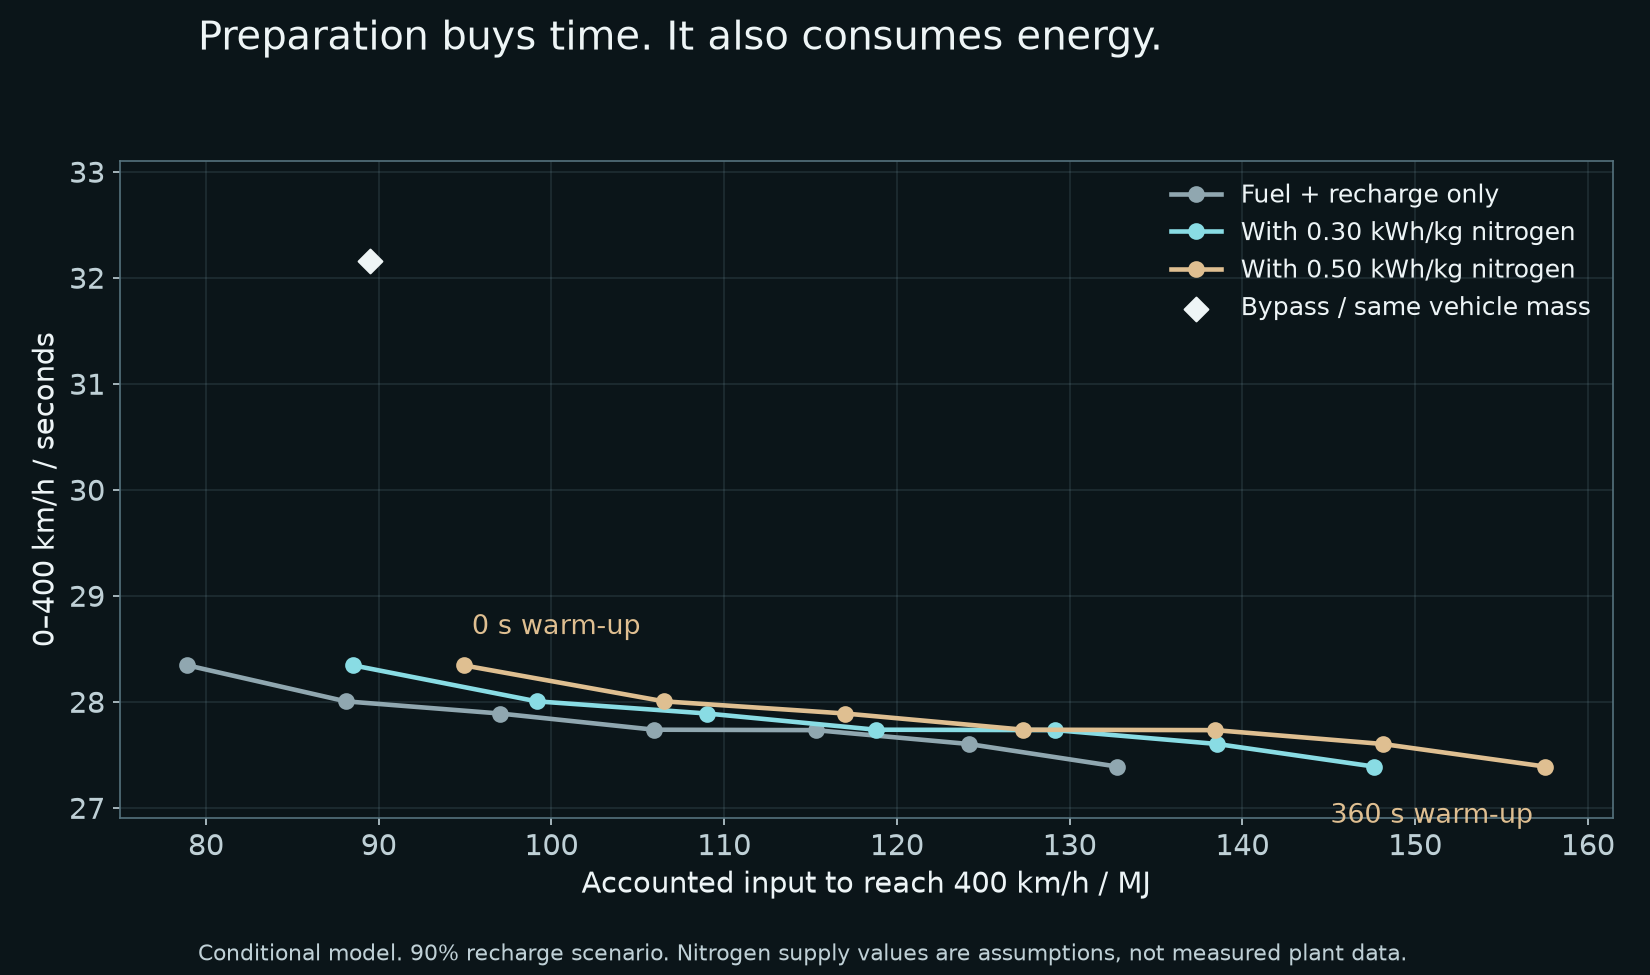
Seven preparation durations were compared before selecting the cold-start policy for the finer-step and carried-state stopping checks. The plot shows energy to reach 400 km/h; the calculator above adds braking. The two supply curves are explicit nitrogen-production scenarios.
On a small screen, scroll the plot sideways. Open the full-size scientific figure ↗
WHAT THE RESULT SUPPORTS
Use preparation deliberately.
The six-minute preparation belongs to the maximum-performance demonstration. For an energy-focused duty, the cold-start policy avoids burning that fuel before the car moves and recovers heat once it is available. Whether recovery also beats bypass depends on the real nitrogen-supply bill.
What is checked
Both cold-start modes carry their launch states into a complete dry stop. Lane, heading and suspension-travel checks pass. Halving the cold-start mechanical step changes the 0–400 result by 0.78 ms and the stop by 0.0013 m. Vehicle, pack and thermal balances are checked separately.
What the accounting includes
Actual simulated engine work is charged through the stated 95% driveline and 32% conversion proxies. The final fuel-source sample is included, correcting a one-step delay in the heat-source ledger. Battery losses, separate control-reserve use, preparation fuel, nitrogen expansion, preparation boil-off and standing losses are retained. Battery heat removal is not counted as another energy source.
Replacement accounting charges liquid consumed during the event and preparation. Full-fill accounting charges all 20 kg without credit for the unused liquid that remains. That second convention is an upfront bill, rather than an inventory-neutral cycle efficiency.
What still needs evidence
The engine fuel map, nitrogen-production and delivery data, charge efficiency, installed heat transfer, pressure losses, component mass and tyre behaviour remain unqualified. The bypass comparator retains the same conservative wet mass and is charged no external nitrogen consumption. A lighter vehicle without the module is a different design study.
Pure nitrogen's physical availability sets a reversible lower bound of about 0.206 kWh/kg for the stated ambient reference. Actual production must also pay for separation, plant irreversibility and delivery. A slider value below that lower bound cannot support a credible net-energy claim.
The current 489.1 km/h figure remains a separate, temporary speed-reserve simulation. This efficiency study does not extend that peak or establish a new top speed. All driving and energy figures remain conditional projections.