Published Chiron: 2.4 s
P4.3 / THE INTEGRATED DIGITAL PROTOTYPE
Faster, with the
costs counted.
Airflow, wheel torque and braking share one finite supply. This revision makes the rotor dynamics, power priorities and upper-vent movement explicit.
Conditional simulation · Physical measurements: 0
Published Chiron: 32.6 s
Published Chiron: 491 m
Published Chiron: 41.96 s
One selected assisted launch and stop. Same fitted engine curve and tyre law. Whole-car mass: 2,744 kg. Preparation is paid before the timed launch. The benchmark is measured; CryoPulse is not.
Original Chiron benchmark ↗Chiron specifications ↗Previous P4.2 record ↗
01 / THE START
Four seconds
to prepare.
The blower ramps to speed before launch. Rotor work, fan demand, battery losses, standby and nitrogen boiloff are counted. The timed sprint starts after that preparation.
4 s preparation target
Earlier P4.2: 8 s. The shorter ramp raises peak motor demand to 72.0 kW, below the catalogue 86 kW peak ceiling. It still needs a measured startup and settling test.
Motor speed0 rpm
Shared electricity0 kW
Floor shaft power0 kW
Illustrative section. Readings follow saved model data. The component STEP study is available below.
02 / A ROTOR THAT HAS TO GET THERE
Pressure follows speed.
Speed takes torque.
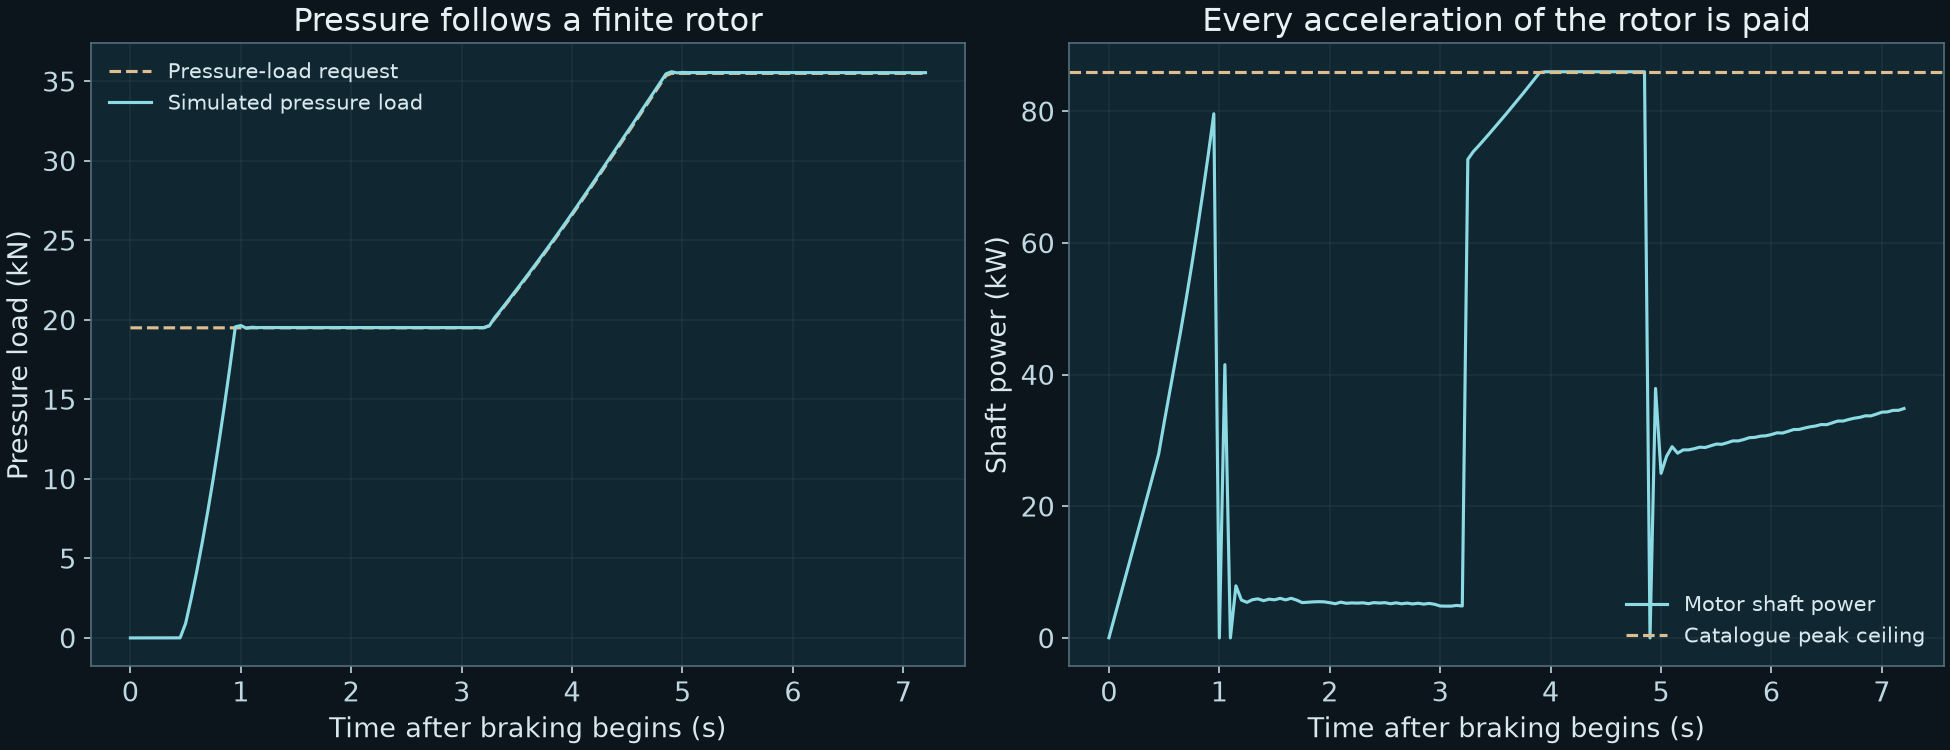
The braking blower begins at rest. Its motor accelerates the rotor while driving airflow. When it coasts, the carried rotational energy pays the fan work.
Floor load
Motor torque
Motor shaft power
0.93 s to 95% of the initial pressure target
The model enforces the EMRAX 208 reference ceilings of 86 kW and 150 Nm. Rotor inertia is capped at 0.18 kg m² as an acceptance requirement. The final dimensioned inertia screen plus 25% remains below that cap.
Pressure feedback is delayed by 50 ms. The controller uses a fixed nominal feedforward and simulated pressure taps; actual seal gap and fan efficiency are not supplied to it.
Catalogue ceilings do not establish the installed winding, efficiency, cooling or pressure-flow maps. These remain bench acceptance targets.
03 / UPPER VENTS AND YAW CONTROL
Direct the air.
Keep room to steer it.
The nominal braking mean moves to 140°. Each bank remains inside the original 110–150° joint range. Individual rate limits prevent collective and differential commands from asking for more travel than the mechanism has.
On a detected port fault or split grip, the mean returns toward 130° to preserve differential authority. Actual left/right joint work is charged once.
6.3 mm nominal suspension-travel margin
The standard and sampled fault cases retain lane, heading and travel checks. Passing these simulations does not establish a road-vehicle safety rating.
Routing illustration. Momentum reaction is counted with mass flow, power and the tyre/suspension response.
04 / CHALLENGE THE ASSUMPTIONS
Keep the controller.
Change the plant.
More drag, wider seal gaps, poorer fan efficiency and higher cell resistance change the answer. A delayed-BMS supervisor cuts optional power when observed consumption runs ahead of the frozen energy budget.
0–100 km/h
0–400 km/h
400–0 km/h
0–400–0 km/h
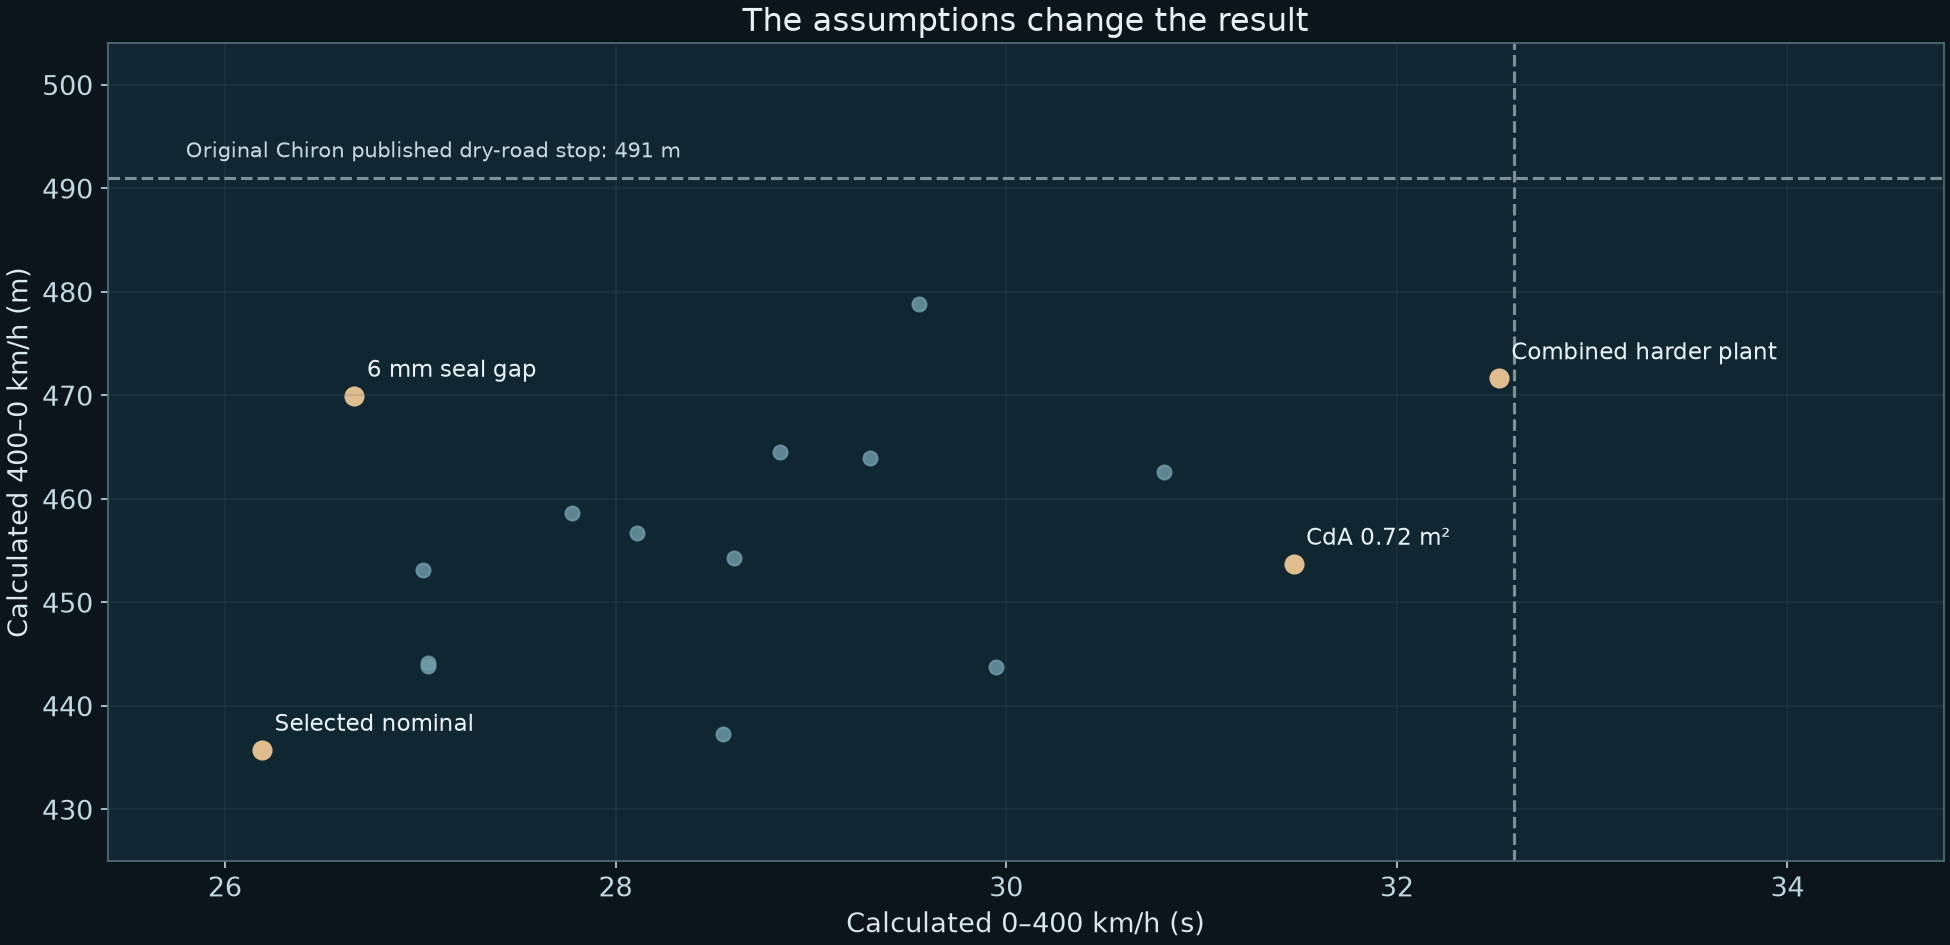
The published Chiron benchmark provides context. CryoPulse is an unmeasured model; these are not matched physical vehicle trials. The sampled points do not represent a failure probability or every possible road condition.
9standard road/fault cases
18fresh road/fault samples
7named plant/BMS cases
12fresh combined samples
All 46 pass their declared completion, trajectory, travel and ledger gates. Halving the time step changes nominal stopping distance by 0.8 mm; refining the pressure surface changes it by 0.3 mm. Numerical convergence is not physical accuracy.
Open the computational audit
- continuous launch and stop
- nine standard road and fault cases
- eighteen fresh sampled road and fault cases
- seven named plant and BMS challenges
- twelve fresh combined plant and BMS cases
- configuration frozen before validation draws
- frozen core sources match
- all mechanical pack and rotor ledgers
- same finite energy windows
- pack current voltage temperature
- consumer bus below 310kW
- original 3MW brake limit
- nominal floor requests attainable in assumed map
- nominal full map 10pct continuous power headroom
- nominal four second start 15pct peak power headroom
- braking floor motor 86kW 150Nm 7000rpm ceiling
- braking floor burst time below catalogue 30s
- upper banks within 110 to 150deg and joint rate
- nominal 5mm suspension travel margin
- thermal first and second laws
- same six kg nitrogen
- mass ledger closes
- blower 80kg budget has over 5kg margin
- preliminary rotor support sizing
- brake rotor inertia covers 25pct CAD allowance
- sampled deck clearances
- half timestep stop within 0p1m
- half timestep 0 400 within 1ms
- refined pressure surface stop within 0p25m
- speed modes carry stores and pay controls
- all four improve P42
05 / THE HARDWARE EARNS ITS PLACE
Support the shaft.
Keep the weight budget.
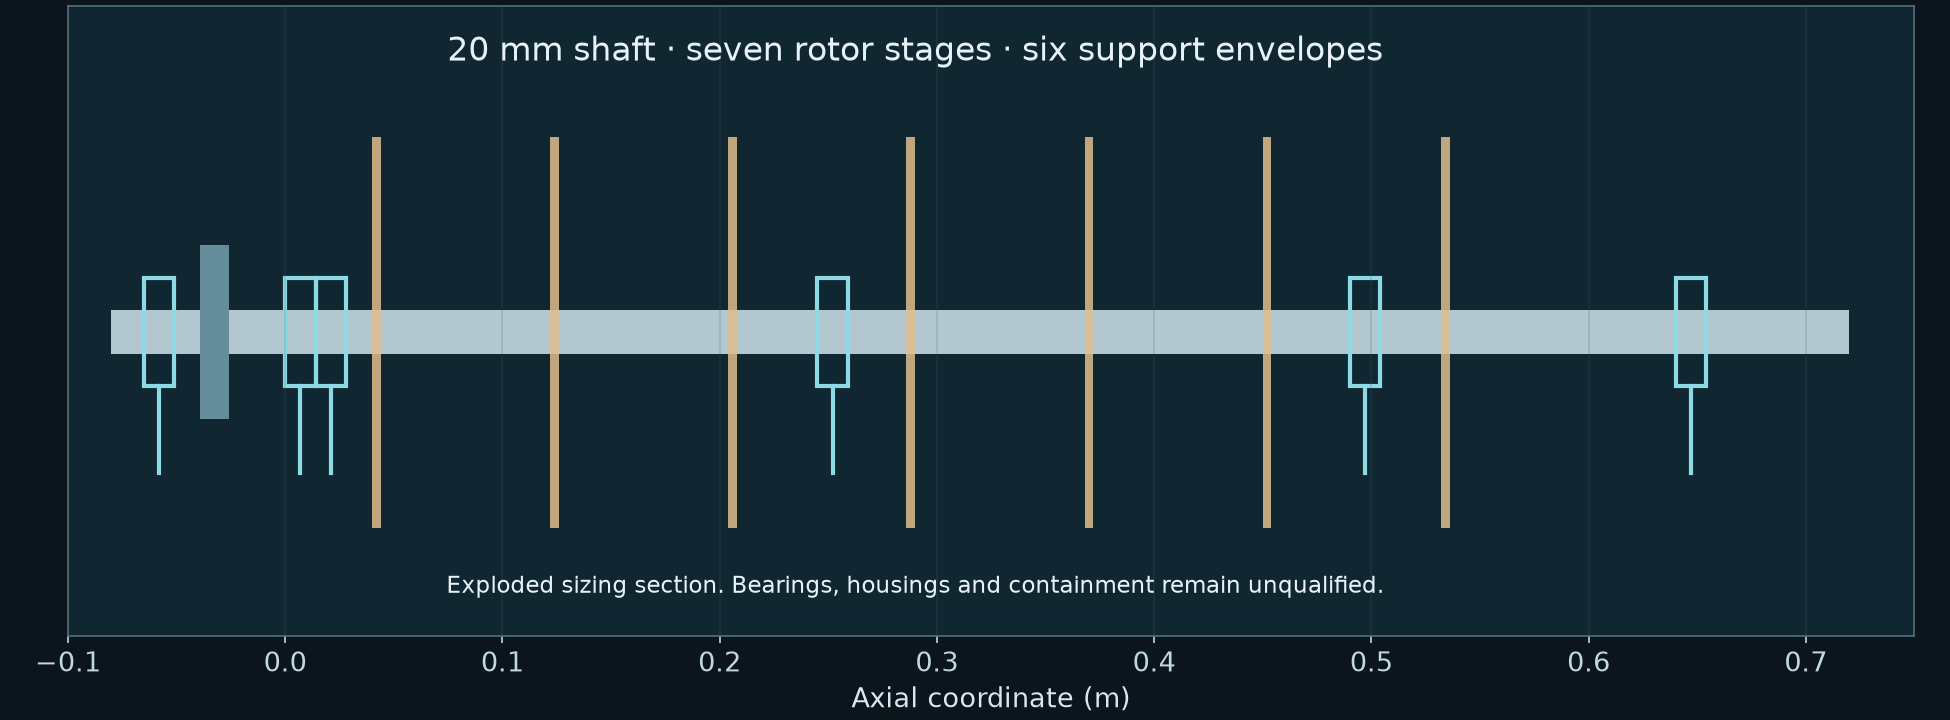
The earlier 17 mm sizing study checked steady power. The final 20 mm shaft covers the 150 Nm motor peak shared across three cartridges, with 25% branch imbalance.
At the declared support stiffness and material properties, the softer-support beam case places its first mode at 2.10 times the operating speed. Combined drive stress is 94.5 MPa against a 100 MPa acceptance requirement.
Fresh, traceable precipitation-hardened 17-4 shaft stock is the material direction. High-strength aluminium rotor blanks remain a manufacturing and fatigue qualification task. No new tyre-material grip bonus is taken.
The unchanged 80 kg blower allowance contains 73.5 kg of parts and allowances, leaving 6.5 kg. Actual matched bearings, preload, housing response, lubrication, fatigue and burst containment remain open.
Native STEP component study ↗Beam and drive-load sizing ↗Mass and startup account ↗
06 / TIMING THE FINITE COLD
The same engine.
A separate speed policy.
481.3 km/h temporary calculated assisted peak
This policy reserves the battery through a slower launch and defers nitrogen flow until the late power pulse. It takes 42.94 s to reach 400 km/h.
The selected sprint above reaches 400 km/h in 26.19 s. Its fast launch and this temporary speed peak belong to different runs and cannot be combined.
Engine-only equilibrium remains about 444.5 km/h in the scalar continuation. The battery, nitrogen and engine-heated metal carry through 400 km/h without a reset.
Cold supports a finite heat-engine process; it does not create a continuous supply of energy. Heat comes from the modeled engine exhaust. The cold inventory is consumed and must later be replenished.
Body drag, engine extrapolation, installed winding map, gearing, tyres and high-speed stability remain unqualified.
Explore the separate speed accounts ↗07 / THE FIRST PHYSICAL EVIDENCE
Two heads.
One force balance.
Pressure-area predictions at 600 Pa. Illustrative rig, not assembled hardware. Equal-power performance must be measured.
A 1:10 stationary comparison tests whether the broader footprint produces more net force after seal leakage and blower power are included.
- Calibrate the force balance and pressure taps; measure hose and fixture forces.
- Compare equal pressure, then equal electrical power, at controlled seal gaps.
- Randomise the order, repeat each pair five times and report uncertainty.
Both heads, the 30 N force abort and 650 Pa pressure bound are specified. A rated external blower and the calibrated fixture still need to be obtained and built.
Pressure-head STEP ↗Full experimental plan ↗Blank measurement sheet ↗
CORRECTION → FIX → RETEST
The errors stay visible.
Two startups exceeded the bus.
Upper-rotor startup now takes the power left after priority loads. A delayed start reduces its available thrust and still pays the full energy cost.
Paying energy did not establish torque.
The floor now carries rotor speed and energy, with finite motor limits. Pressure follows the actual simulated speed and delayed pressure control.
The shaft also sees peak torque.
The final shaft and bearing envelopes were enlarged within unused mass allowance. The motor peak and a branch imbalance are included in the sizing case.
This is still the beginning.
The wider twelve-part CryoPulse programme remains unfinished. This release joins more of the driving system in one model and specifies the next physical demonstration.
No credible completion percentage has been measured. Whole-body CFD, installed fan and moving-road seal tests, tyre load response, the cell-resistance window, motor cooling and winding maps, cold-stage tests, complete cabin/crash/fuel packaging and vehicle validation remain ahead.
The effective engine curve is fitted to published reference performance. Passing a calibrated comparison is not independent confirmation of the modeled advantage. The 0.57 m² drag-area target, the inherited effective-leak factor and other component assumptions must be replaced with measurements.
Layout CAD, component sizing and reproducible calculations are available now. They support an engineering proposal; they do not establish a built, safe or road-tested hypercar.
Inspect the evidence.
Source, results & CAD ZIP ↗The selected run ↗Named challenges ↗Fresh plant/BMS samples ↗
Primary component references
EMRAX 208 V1.7: mass and catalogue limits. SKF angular-contact catalogue: bearing sizing envelopes. ATI 17-4 data: material direction. These references do not qualify the installed assembly.