+1.10 MJ
Translational kinetic energy
P4.5 / AIRFLOW RESEARCH
Make the next
100 km/h count.
A fast launch is only the beginning. The next challenge is keeping more of the engine’s power available as speed rises.
New diagnostic study. The current driving benchmark remains P4.4.
2.08s0–100 km/h
Current conditional model
Current conditional model
16.24s300–400 km/h alone
The next problem to solve
The next problem to solve
0Physical measurements
Targets await validation
Targets await validation
EQUAL SPEED STEPS / UNEQUAL TIME
Every next 100
takes more work.
At twice the speed, kinetic energy is four times as large. With unchanged air density and drag area, drag is four times as large and the power to overcome it is eight times as large. Acceleration follows the power left after those losses.
+3.29 MJ
Translational kinetic energy
+5.49 MJ
Translational kinetic energy
+7.69 MJ
Translational kinetic energy
Each bar is one additional 100 km/h from the saved P4.4 launch. These are model outputs, not road measurements. Cumulative 0–200 time is 6.69 s; 4.61 s is the 100–200 interval.
TIME FROM LAUNCH2.08 s
FLOOR DOWNFORCE—
POWERED REAR AIR—
WHEEL ASSIST—
Readings interpolate saved states for this display. The selected rear-fan policy switches off above 150 km/h; the floor request fades from 110 to 150 km/h. That choice is now being tested.
ONE CAR / DIFFERENT AIRFLOW JOBS
Grip. Speed.
Then stopping.
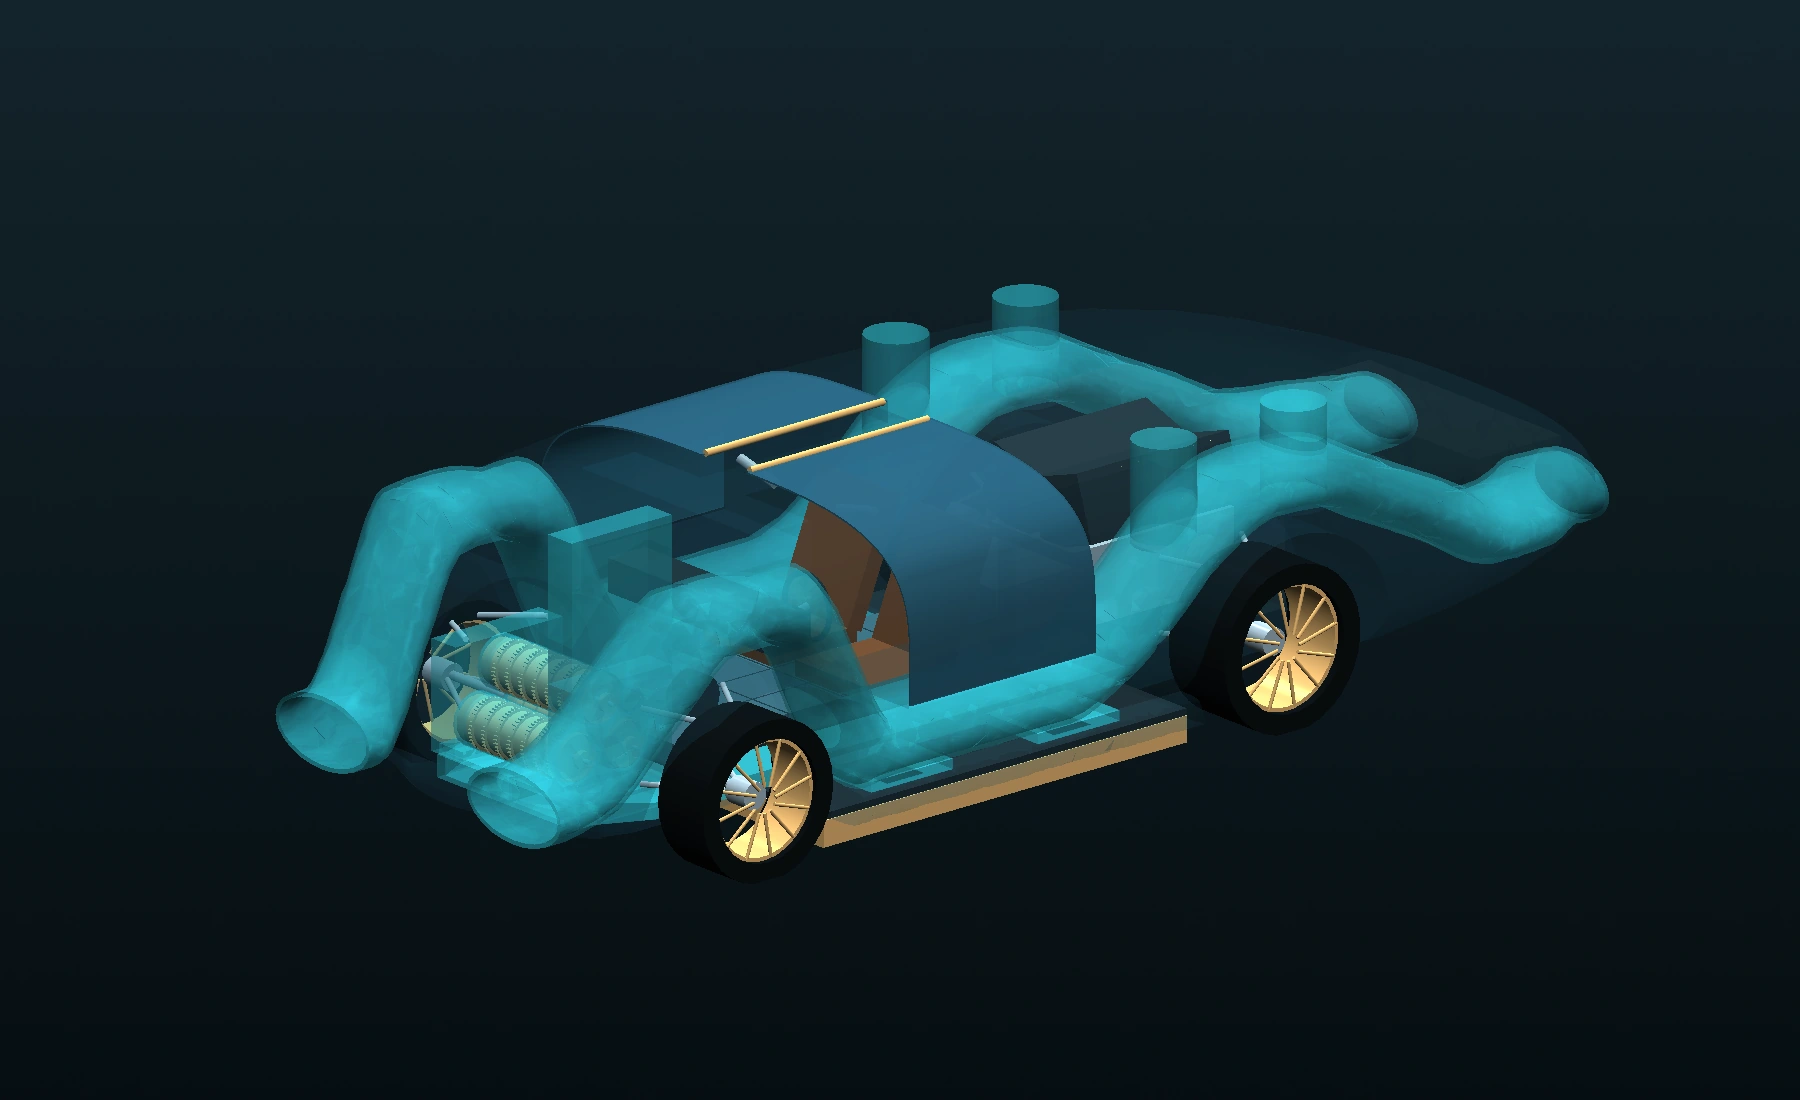
Downforce increases tyre loading without increasing the car’s mass. At high speed, the priority changes to reducing losses and controlling the wake. During braking, upper outlets can redirect the air and apply a reaction force.
LAUNCH / CONTACT FIRST
Press the tyres into the road.
The powered floor lowers pressure underneath the car. The resulting downward force raises the available tyre force under the assumed grip law. Fan demand, leakage, suspension movement and tyre load sensitivity are included in the current model.
Operating-mode schematic based on the layout. Arrows show commanded direction, not CFD velocity or validated force. Gravity supplies the car’s weight; the air system supplies additional downward force. Neither is credited as forward energy on a level road.
SWITCH THE FUNCTIONS / KEEP THE CAR
What does the
air system add?
Same installed mass. Same initial battery. Same engine and wheel-assist limits. These runs isolate the floor and rear-fan functions inside the current model. Their unused energy remains available to the shared controller.
| Enabled air functions | 0–100 | 0–200 | 0–400 |
|---|---|---|---|
| Neither powered / open airways | 3.44 s | 8.11 s | 32.16 s |
| Powered floor only | 2.12 s | 6.78 s | 30.85 s |
| Powered rear fan only | 3.33 s | 7.94 s | 32.04 s |
| Floor + rear fan / current | 2.08 s | 6.69 s | 30.79 s |
All main airways remain present and open. Off cases retain their passive airway forces; hardware mass is not removed. This is a model comparison, without physical validation. No new combined stop or top-speed score is inferred from these launch runs.
A useful control trade-off.
The floor-first launch keeps 1.09 MJ more chemical energy by 400 km/h while taking 0.055 s longer to get there. Carrying that exact state into the unchanged brake controller gives 456.7 m and 38.41 s for the combined event. Stopping distance changes very little. This research variant has not replaced the selected build or completed its full challenge campaign. Inspect the continuous event ↗
THE EARLIER SPEED / A NEW REQUIREMENTS TEST
What would it take
to reach 481.3?
The current conditional reserve-speed model peaks at 458.8 km/h. To revisit 481.3 km/h, the duct and body must work together. Turning up the same fan is a poor use of the available electrical energy through the current long duct.
One carried state. One finite budget.
Every speed study starts from the same saved 400 km/h state after the 52.22 s reserve launch. It keeps the engine curve, 8 MJ late-assist budget, 310 kW shared consumer limit and finite battery state. There is no fresh battery at 400 km/h.
Changed duct losses are hypothetical requirements at the same saved state. Packaging mass and the earlier launch must be recomputed before selecting a new design. The ideal loss-free airway is a comparison bound.
CURRENT GEOMETRY / DIAGNOSTIC458.8km/h
INVERSE CALCULATION / REQUIREMENTS, NOT ACHIEVED SPEEDS
Two aero targets to work towards.
We solve for the external drag area that would make the finite-event model reach 481.3 km/h. A drag area is a shape-dependent requirement in m², not a drag coefficient by itself. Lower is better.
Keep the current duct-loss requirement
0.548m²Required external drag area to reach the 481.3 km/h target in this matched-state calculation.
- Body drag-area reduction
- 15.7%
- Duct loss coefficient
- 2.5
Reduce the duct loss to K=1.0
0.562m²Required external drag area to reach the 481.3 km/h target in this matched-state calculation.
- Body drag-area reduction
- 13.5%
- Duct loss coefficient
- 1
Reduce the duct loss to K=0.3
0.593m²Required external drag area to reach the 481.3 km/h target in this matched-state calculation.
- Body drag-area reduction
- 8.7%
- Duct loss coefficient
- 0.3
Use rear air for post-400 assistance
0.519m²Required external drag area to reach the 481.3 km/h target in this matched-state calculation.
- Body drag-area reduction
- 20.1%
- Duct loss coefficient
- 0.3
K=0.3 means an 88% reduction from the current assumed duct-loss coefficient of 2.5; it does not mean an 88% reduction in vehicle drag. The same mass is held for this isolation study. No new shape has earned these values. The air-only assist case keeps the propulsion engine driving the wheels and uses the rear fan for the additional post-400 assistance. It does not use an extra wheel motor in that continuation.
TURN THE REQUIREMENT INTO A DESIGN
The next work
has a clear target.
Lower losses need a shape, a measured map and a complete system replay. These are the remaining steps before any new figure replaces the current benchmark.
Physics and reference mechanisms
The drag and thrust accounts follow NASA’s drag equation and momentum/pressure thrust equation. The high-speed power scaling follows by multiplying drag by speed, for fixed drag area and density.
Gordon Murray Automotive’s T.50 demonstrates the use of a fan with different aero modes. Its published improvements are not transferred to CryoPulse.
Source configuration SHA-256: 16b6693b07c1…6240ceab. All results here are conditional calculations. Physical measurements: 0. Vehicle not built.