Chiron: 2.4 s
P4.4 / THE CURRENT DRIVING MODEL
Could this car
beat the Chiron
benchmark?
Air through the body. Pressure under the floor.
One finite power account, from launch to stop.
Theoretical targets · Physical measurements: 0
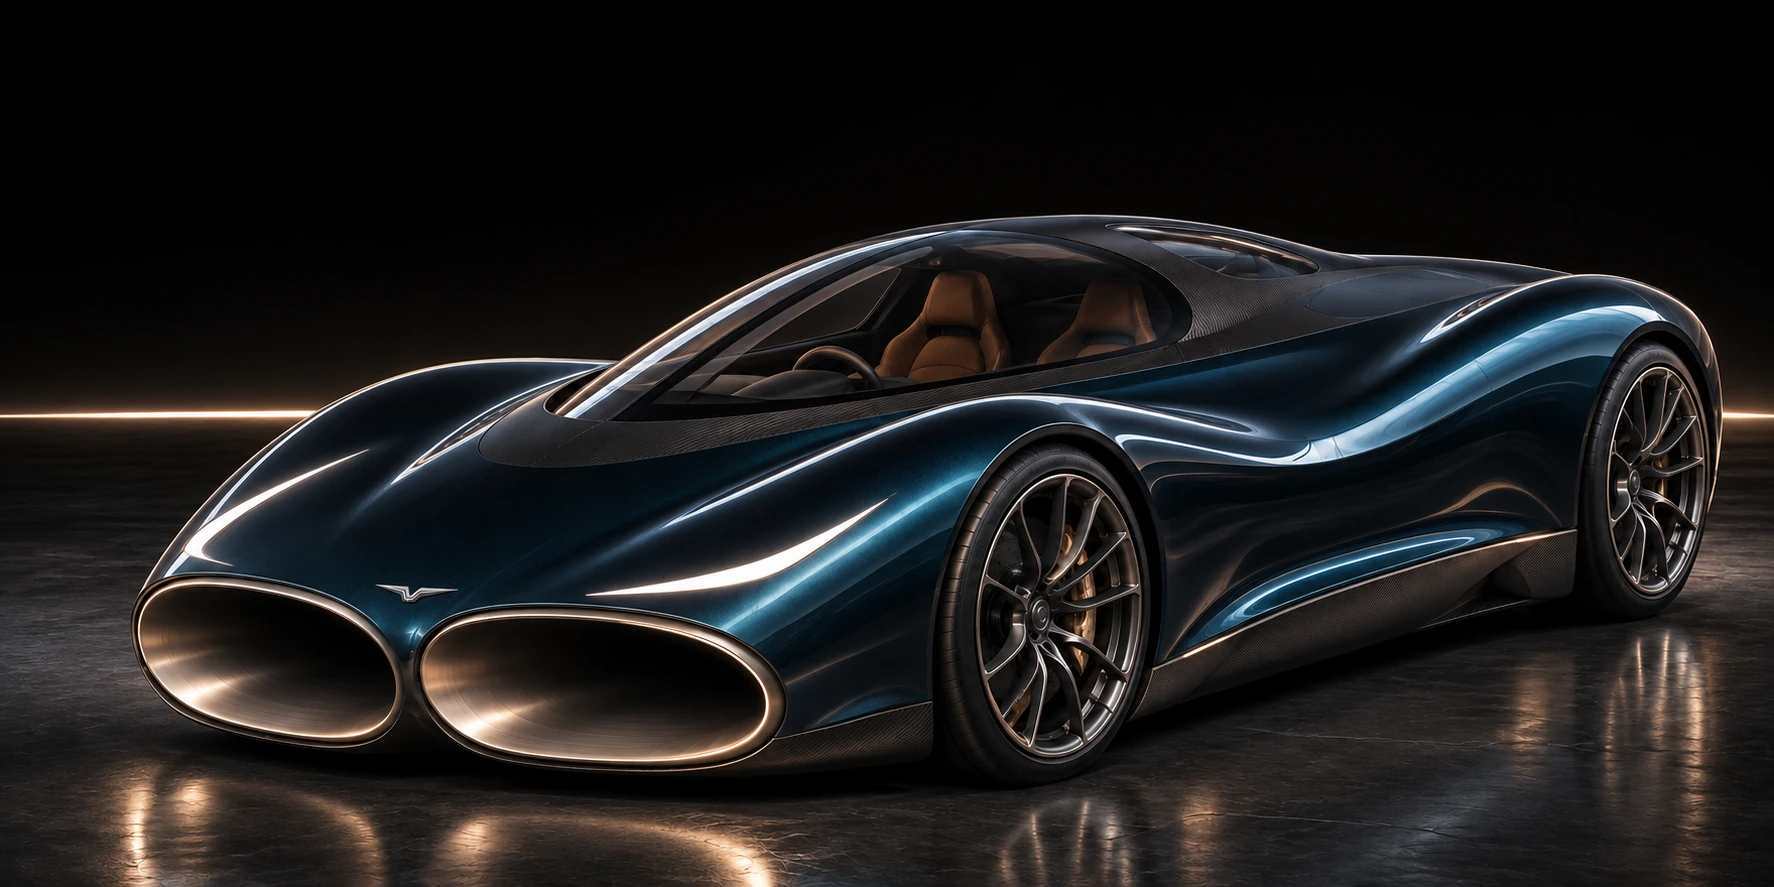
ONE SELECTED CONFIGURATION
The complete run.
The complete account.
30 stated computational checks pass. Physical measurements: 0.
Chiron: 32.6 s
Chiron: 491 m
Chiron: 41.96 s
Conditional projections, compared with published original Chiron figures.
Same fitted effective engine curve; additional precharged electrical assistance. The model includes 2,846 kg, a 16 MJ chemical / 12.8 MJ DC exchange window, a source-derived 500 A continuous-current drive envelope and unqualified aerodynamic, tyre and installed-fan targets. Four seconds of paid prelaunch preparation precede the timed run.
One saved launch and stop km/h
FLOOR LOAD—
POWERED AIR—
DC WINDOW LEFT—
Saved CryoPulse model Published Chiron landmarks
Only the CryoPulse line is a calculated trace. The reference markers are published landmarks, with no invented Chiron trajectory between them.
EVERY INTERVAL
| Event | Chiron Published | CryoPulse Conditional |
|---|---|---|
| 0–100 km/h | 2.4 s | 2.08 s |
| 0–200 km/h | 6.1 s | 6.69 s |
| 0–300 km/h | 13.1 s | 14.55 s |
| 0–400 km/h | 32.6 s | 30.79 s |
| 400–0 km/h | 491 m | 456.7 m |
| 0–400–0 km/h | 41.96 s | 38.35 s |
The selected model is slower over 0–200 and 0–300 km/h. A projected improvement in one interval does not establish improvement in every interval or statistical significance.
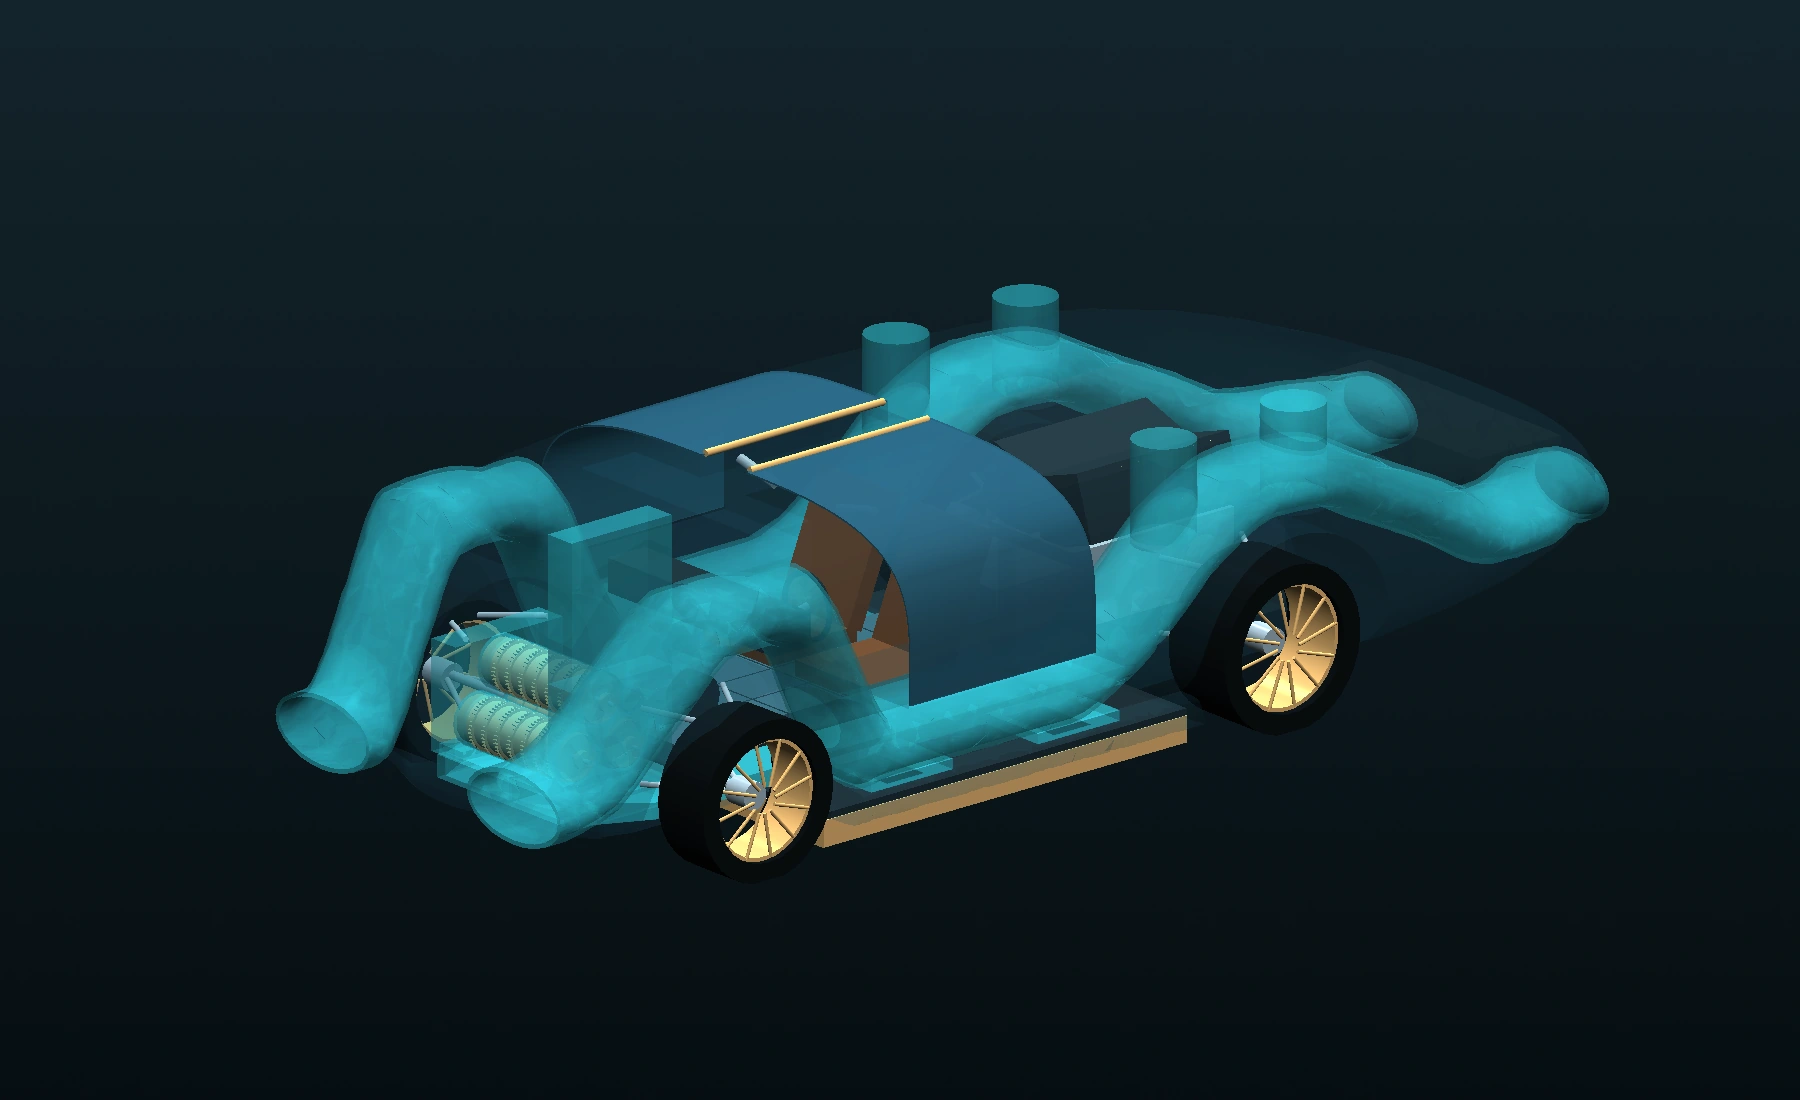
ACTUAL LAYOUT CAD
The wheels turn.
The doors open.
The air has a route.
The front machine bank, straight floor feeds and raised pack now fit the declared protected-duct and cabin allocations. The geometry remains a developing layout.
22 mmFeed / protected-duct clearance
30 mmPack mounting-height change
96Declared moving-wheel checks
0.40 m³Upstream air-volume budget
The STEP and GLB contain dimensional layout solids and component allocations. Supplier powertrain geometry, rib joints, complete chassis/crash structure, occupant accommodation and service paths remain unqualified. Schematic airflow animation is not CFD.
THE MAIN BATTERY ACCOUNT
Useful work.
Counted losses.
Motor torque follows current and loaded voltage. Blowers, startup, controls and wheel assistance draw from the same finite stores; recovery is credited once.
—MJ net chemical energy drawn
Preparation + launch + braking
The net DC term already includes accepted recovery. A separate finite low-voltage reserve pays additional control loads. The 3% pack-to-bus loss is a declared budget; installed electrical and thermal maps require measurement.
16 MJ chemical / 12.8 MJ DC
A declared exchange window from the precharged 216s9p pack. It is larger than the previous P4.3 event window; no same-total-energy claim is made against the Chiron.
500 A continuous-current envelope
The manufacturer's motor grid and inverter rating constrain wheel assistance. Voltage scaling is approximate; installed motor and cooling capability still need qualification.
Finite pressure and rotor speed
The model carries cavity mass, air availability and rotor energy through preparation, launch and braking. Requested floor load takes time and power to arrive.
SAME FITTED ENGINE / NO SPEED LIMITER IN THE MODEL
A separate
top-speed question.
A reserve-battery event has its own slower launch. Its temporary assisted peak cannot be combined with the fastest sprint or a fresh store at 400 km/h.
Scalar equilibrium with passive through-flow, current mass and the external drag target.
Finite late wheel assistance, with the source-derived continuous-current envelope and carried stores.
Unrestricted CryoPulse calculations are not matched to an unrestricted Chiron test. The original Chiron's published road-use limit is 420 km/h; the Super Sport 300+ achieved 490.484 km/h in its record run. No claim here exceeds that record. Engine extrapolation, gearing, tyres, cooling and high-speed stability remain unqualified.
Inspect every speed policy and its energy use ↗THE NEXT PHYSICAL EXPERIMENT / CF-1.1
Put the cold-flow idea
on a bench.
The selected driving build excludes the heavier nitrogen-stage research option. The cooling mechanism gets a direct, controlled experiment of its own.
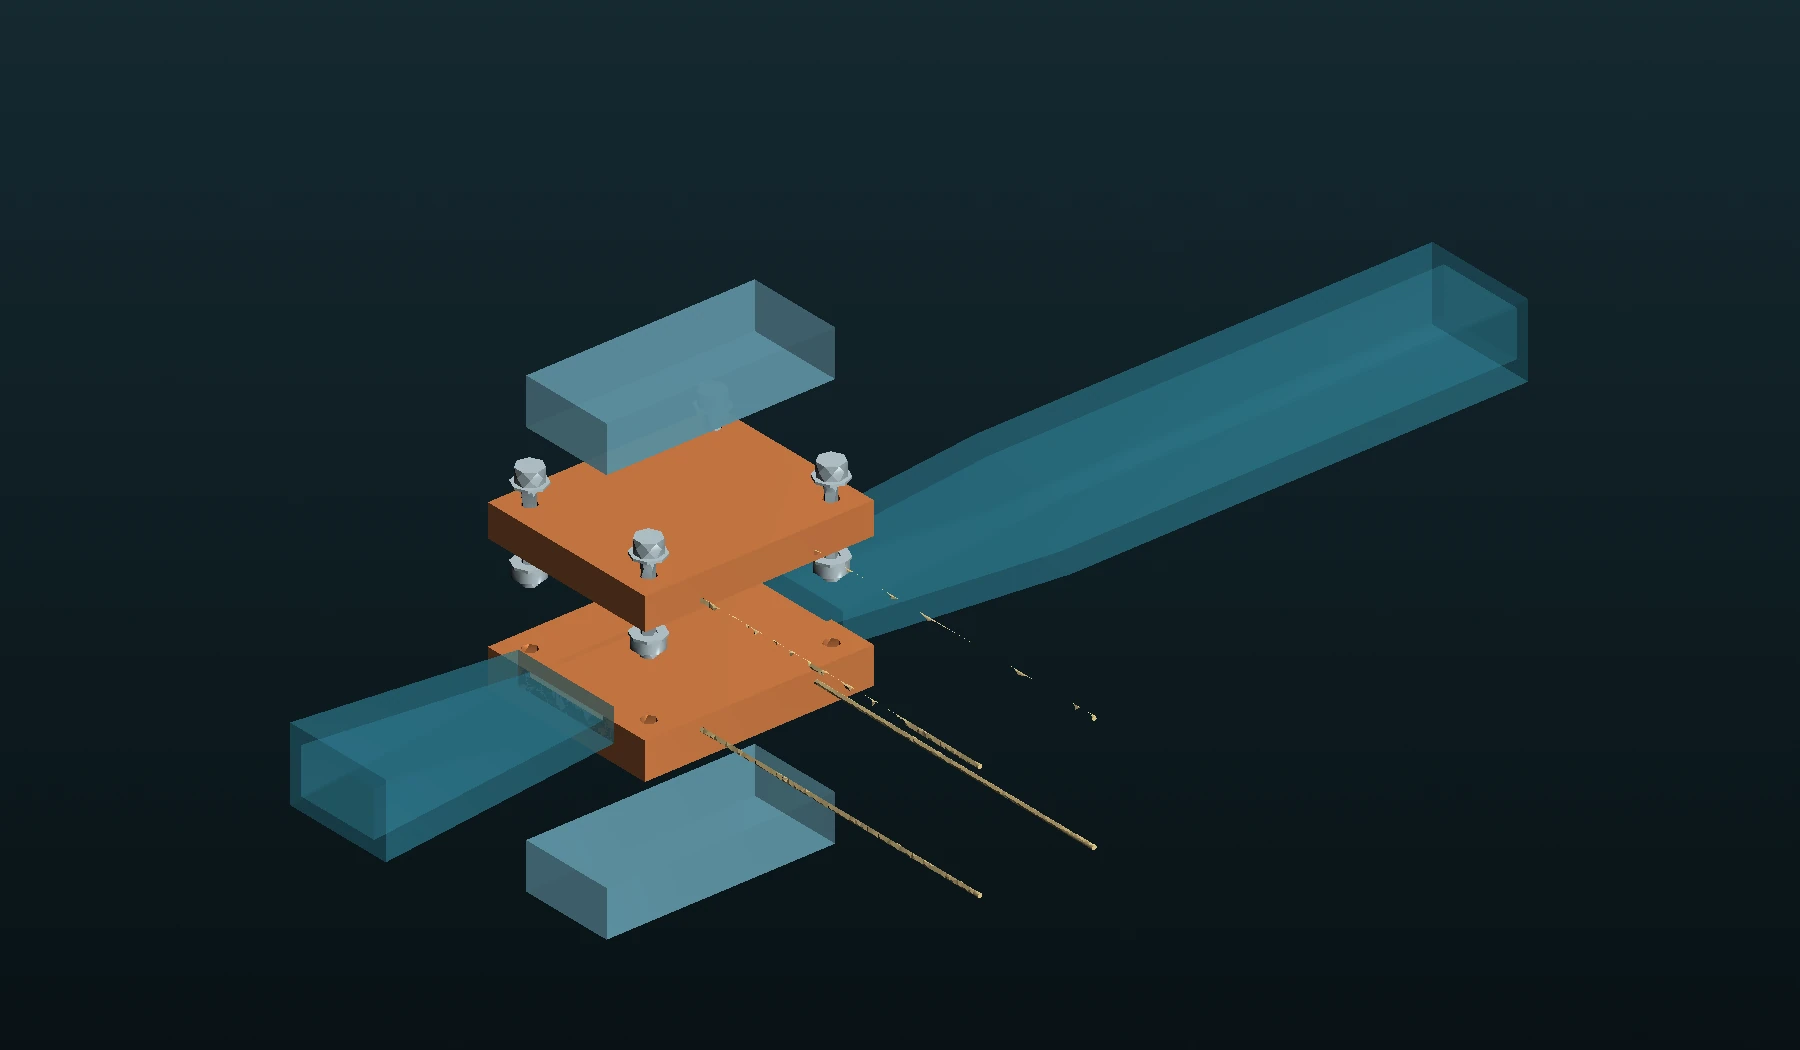
20°C → 0°CSame channel. Same pressure head.
Four wall probes and a fixed twelve-pair schedule compare warm and cold conditions. Flow, cooling duty and electrical input stay separate.
The independent 1D reference predicts a flow increase under its declared heat-transfer and loss assumptions. Resolved CFD remains under numerical review. Neither is a physical result.
Open the visual laboratory ↗Download the bench design ↘Assembly and heat-measurement notes ↗PLAN THE PRECISION / NO EXPERIMENTAL DATA
Make the experiment
able to see the effect.
The twelve-pair test stays fixed. This planning study asks how repeatable the paired readings must be after the declared flow and pressure bounds are subtracted.
0.45 %Paired log-ratio SD target
For the smaller calculated effect
For the smaller calculated effect
90 %Conditional planning probability
At that precision target
At that precision target
200,000Virtual repetitions per condition
Checked against the noncentral t calculation
Checked against the noncentral t calculation
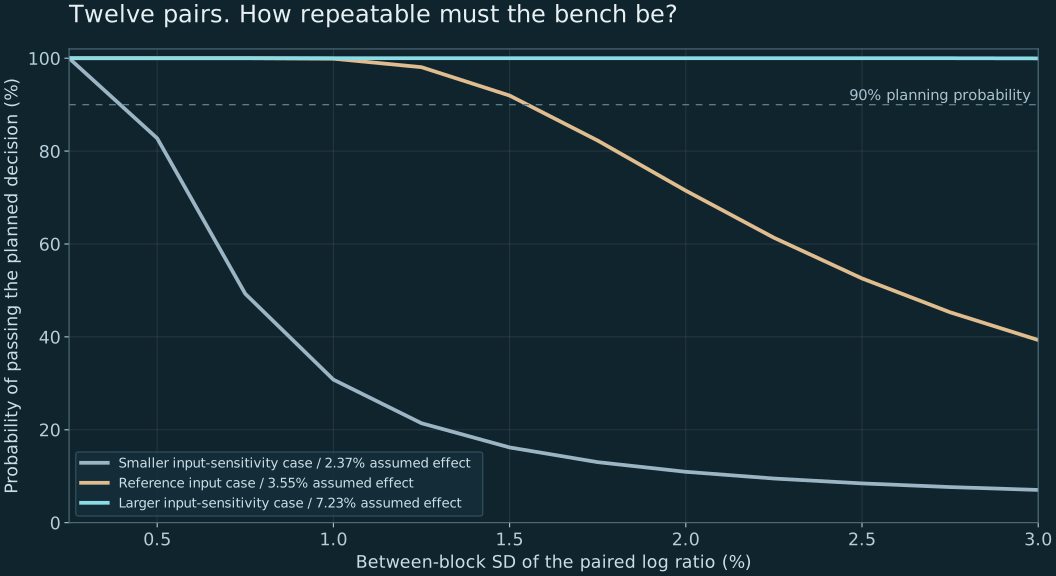
The approximately 0.45% target concerns the smaller 2.37% flow-effect scenario. It assumes independent normally distributed paired log ratios and genuine calibration bounds. Every physical quality gate must still pass; rejected runs and non-normal behaviour are outside this planning calculation. No sample count or primary endpoint was changed. Reference distribution: SciPy noncentral t ↗
REPRODUCIBLE COMPUTATION / ZERO HARDWARE MEASUREMENTS
Open the result.
Inspect the assumptions.
The source package freezes the selected configuration, its inputs, calculations, failed checks and corrections. Numerical agreement is kept separate from physical validation.
Standard road and fault cases
Computed checks pass.
Sampled road and actuator cases
Computed checks pass.
Named plant and battery cases
Computed checks pass.
Sampled combined plant cases
Computed checks pass.
Download the frozen source ↘Read the computational audit ↗Download the review companion ↘Clean-source replay ↗Run it yourself ↗Read the selected configuration ↗Previous P4.3 archive ↗
A fitted reference model and passing sampled cases do not prove a measured advantage over a Bugatti, estimate a failure probability or certify a safe vehicle. Reported projected differences remain conditional.
ONE FROZEN CONTROLLER / ALL 46 CASES
Change the conditions.
See what changes.
The nominal score is one case. Road and component challenges test completion, lane position, heading and declared resource limits. A passing case can still lose the benchmark advantage.
Road cases change grip and faults. Plant cases keep the dry road and change the machinery or battery assumptions. The published Chiron figures are not matched tests in these altered conditions.
Read all cases and their checks ↗400–0 KM/H / SAVED CALCULATION—
STOPCompleteLANE + HEADING + TRAVELWithin declared model limits
TURN AN ASSUMPTION INTO A SUPPLIER BRIEF
The tyre has to
carry the load.
Floor pressure changes the tyre load. The saved run now becomes a concrete load-versus-speed request for a tyre supplier, before the assumed grip law can be qualified.
21.9 kNLargest saved corner load
During the selected launch
During the selected launch
19.5 kNLargest saved corner load
During the selected stop
During the selected stop
0Supplier tyre qualifications represented
The current grip law remains a requirement
The current grip law remains a requirement
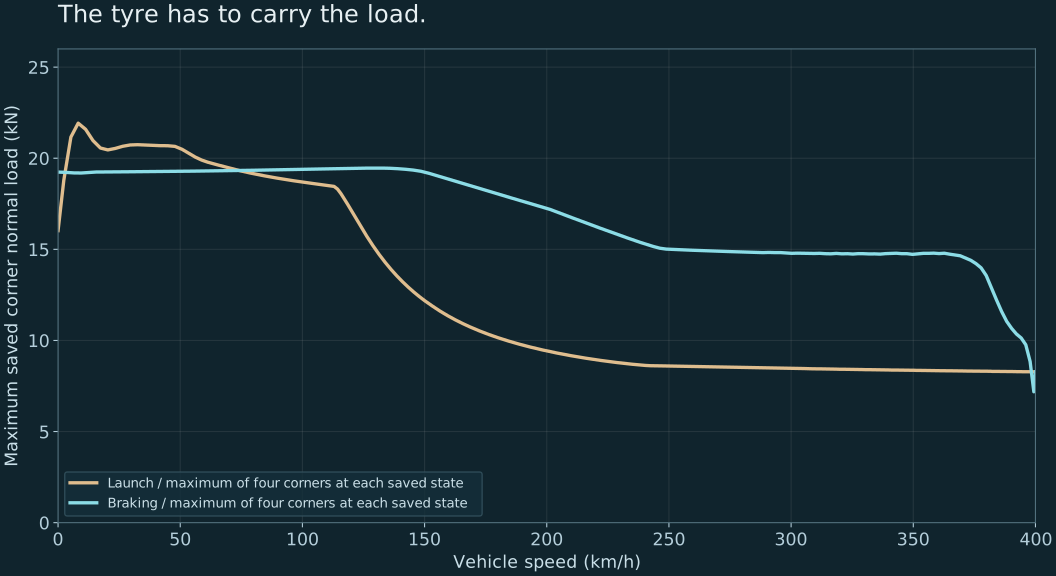
This does not establish that a current Chiron tyre can carry these loads. Load, speed, temperature, slip, wheel retention and repeated-run behaviour require supplier maps and a coupled replay. The separate 458.8 km/h scalar event still needs its full high-speed load and stability calculation.
Open the sampled load brief ↗THE REMAINING ENGINEERING
The car is still
a research programme.
The bench design gives the cooling question a path to measurement. The whole vehicle still has digital design and hardware-qualification work to complete.
Earn the drag target.
Qualified moving-ground whole-car CFD, duct/exterior interaction and wind-tunnel measurements. The 0.65 m² external target is not an achieved coefficient.
Measure the installed maps.
Rotor pressure/flow, efficiency, road-seal leakage, startup, containment and cooling across the working range.
Qualify load and grip.
Supplier tyre load/speed/slip behaviour, an independently validated reference and matched road conditions.
Qualify the working window.
Actual cell OCV/resistance, pack temperatures, complete motor maps, cooling and repeated-run duty.
Complete the receiving vehicle.
Powertrain supplier CAD, laminate/rib joints, full chassis load paths, crash structures, service access and occupant accommodation.
Test beyond the scalar model.
Full multibody and aero stability, sensor faults, actuator dynamics and hardware-in-the-loop before a physical vehicle test.
ENGINEERING REVIEW + LABORATORY PARTNERS
Help measure
the next step.
Primary reference sources
Bugatti 0–400–0 benchmark ↗Chiron technical data ↗Super Sport 300+ record context ↗Cascadia Motion drive data ↗Molicel P50B ↗EMRAX floor-motor data ↗
No Bugatti affiliation or endorsement is implied.