A more detailed model brings wheel rotation, brake pressure and suspension into the airflow calculation. Explore its results and the first bench assembly.
Calculated performance. Nominal CAD. An unbuilt vehicle.
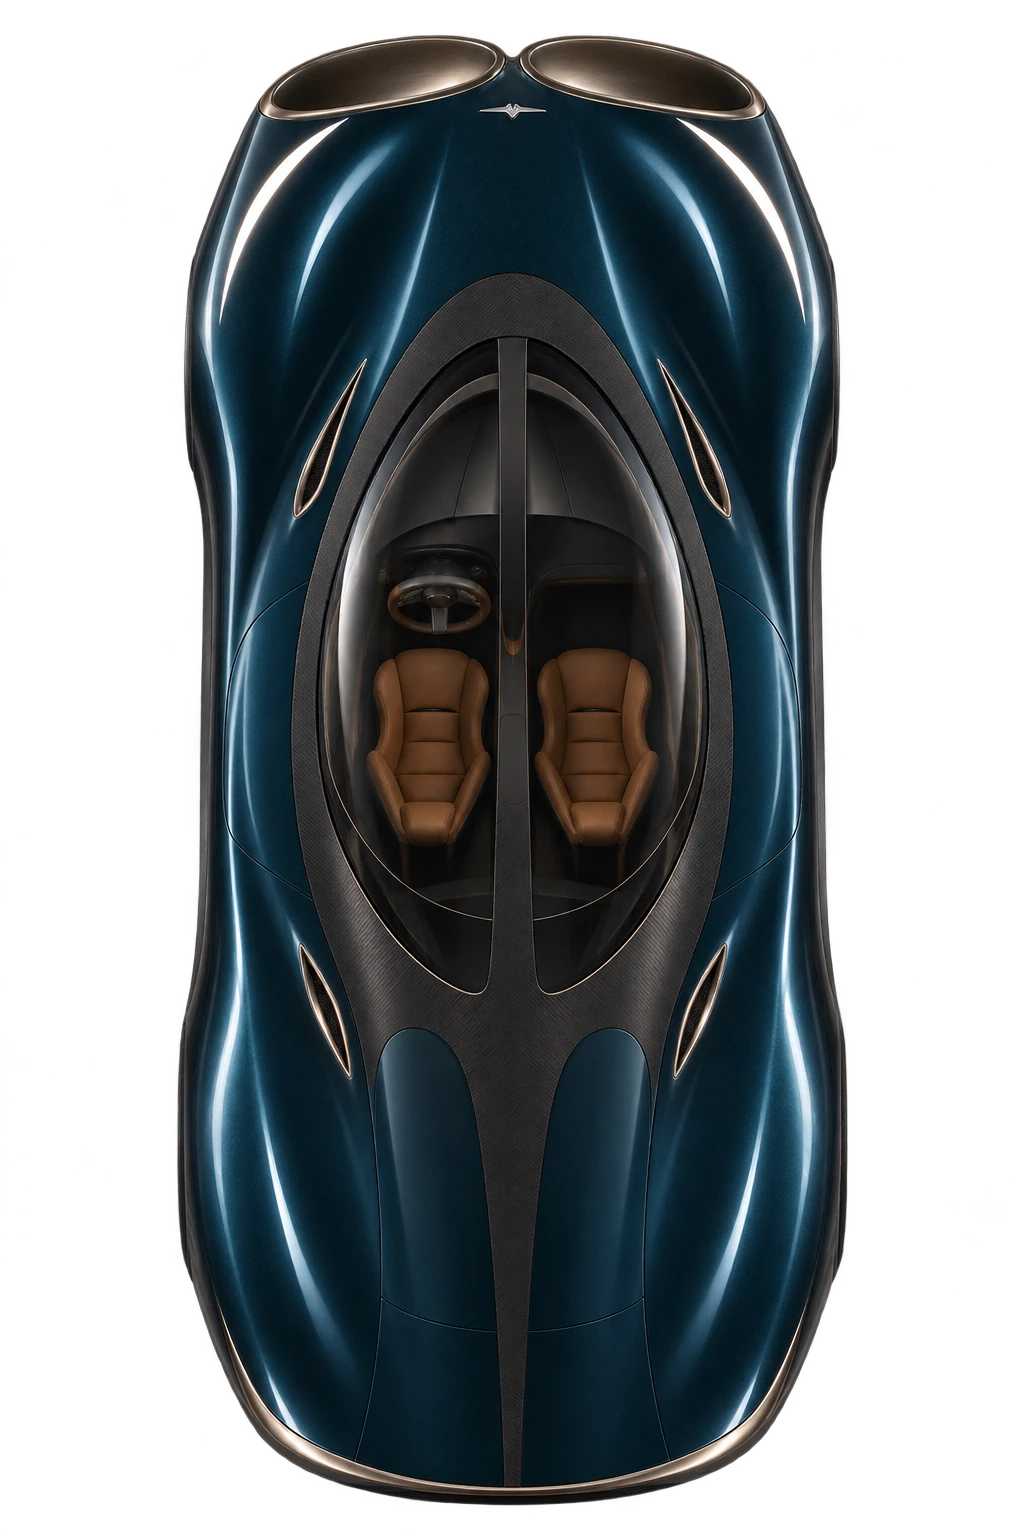
Through-flow concept · Designed by Genyra
Conditional numerical results. Physical measurements: 0. A more detailed model strengthens the design work. The tyre, fan, flow and hardware targets still need measurement before any real-car performance claim.
473.8m400–0 km/h · air systems operating 562.3 m with air systems off, at the same mass
15.7%Shorter modelled dry stop Matched virtual hardware and initial stores
121checksWithin the declared numerical tests 32 fresh combined cases after the design was frozen
4outletsDetailed dry-air bench assembly Three nominal rigid poses checked
01 · Wheels, brakes, airflow and direction
Watch the stop. Then look underneath it.
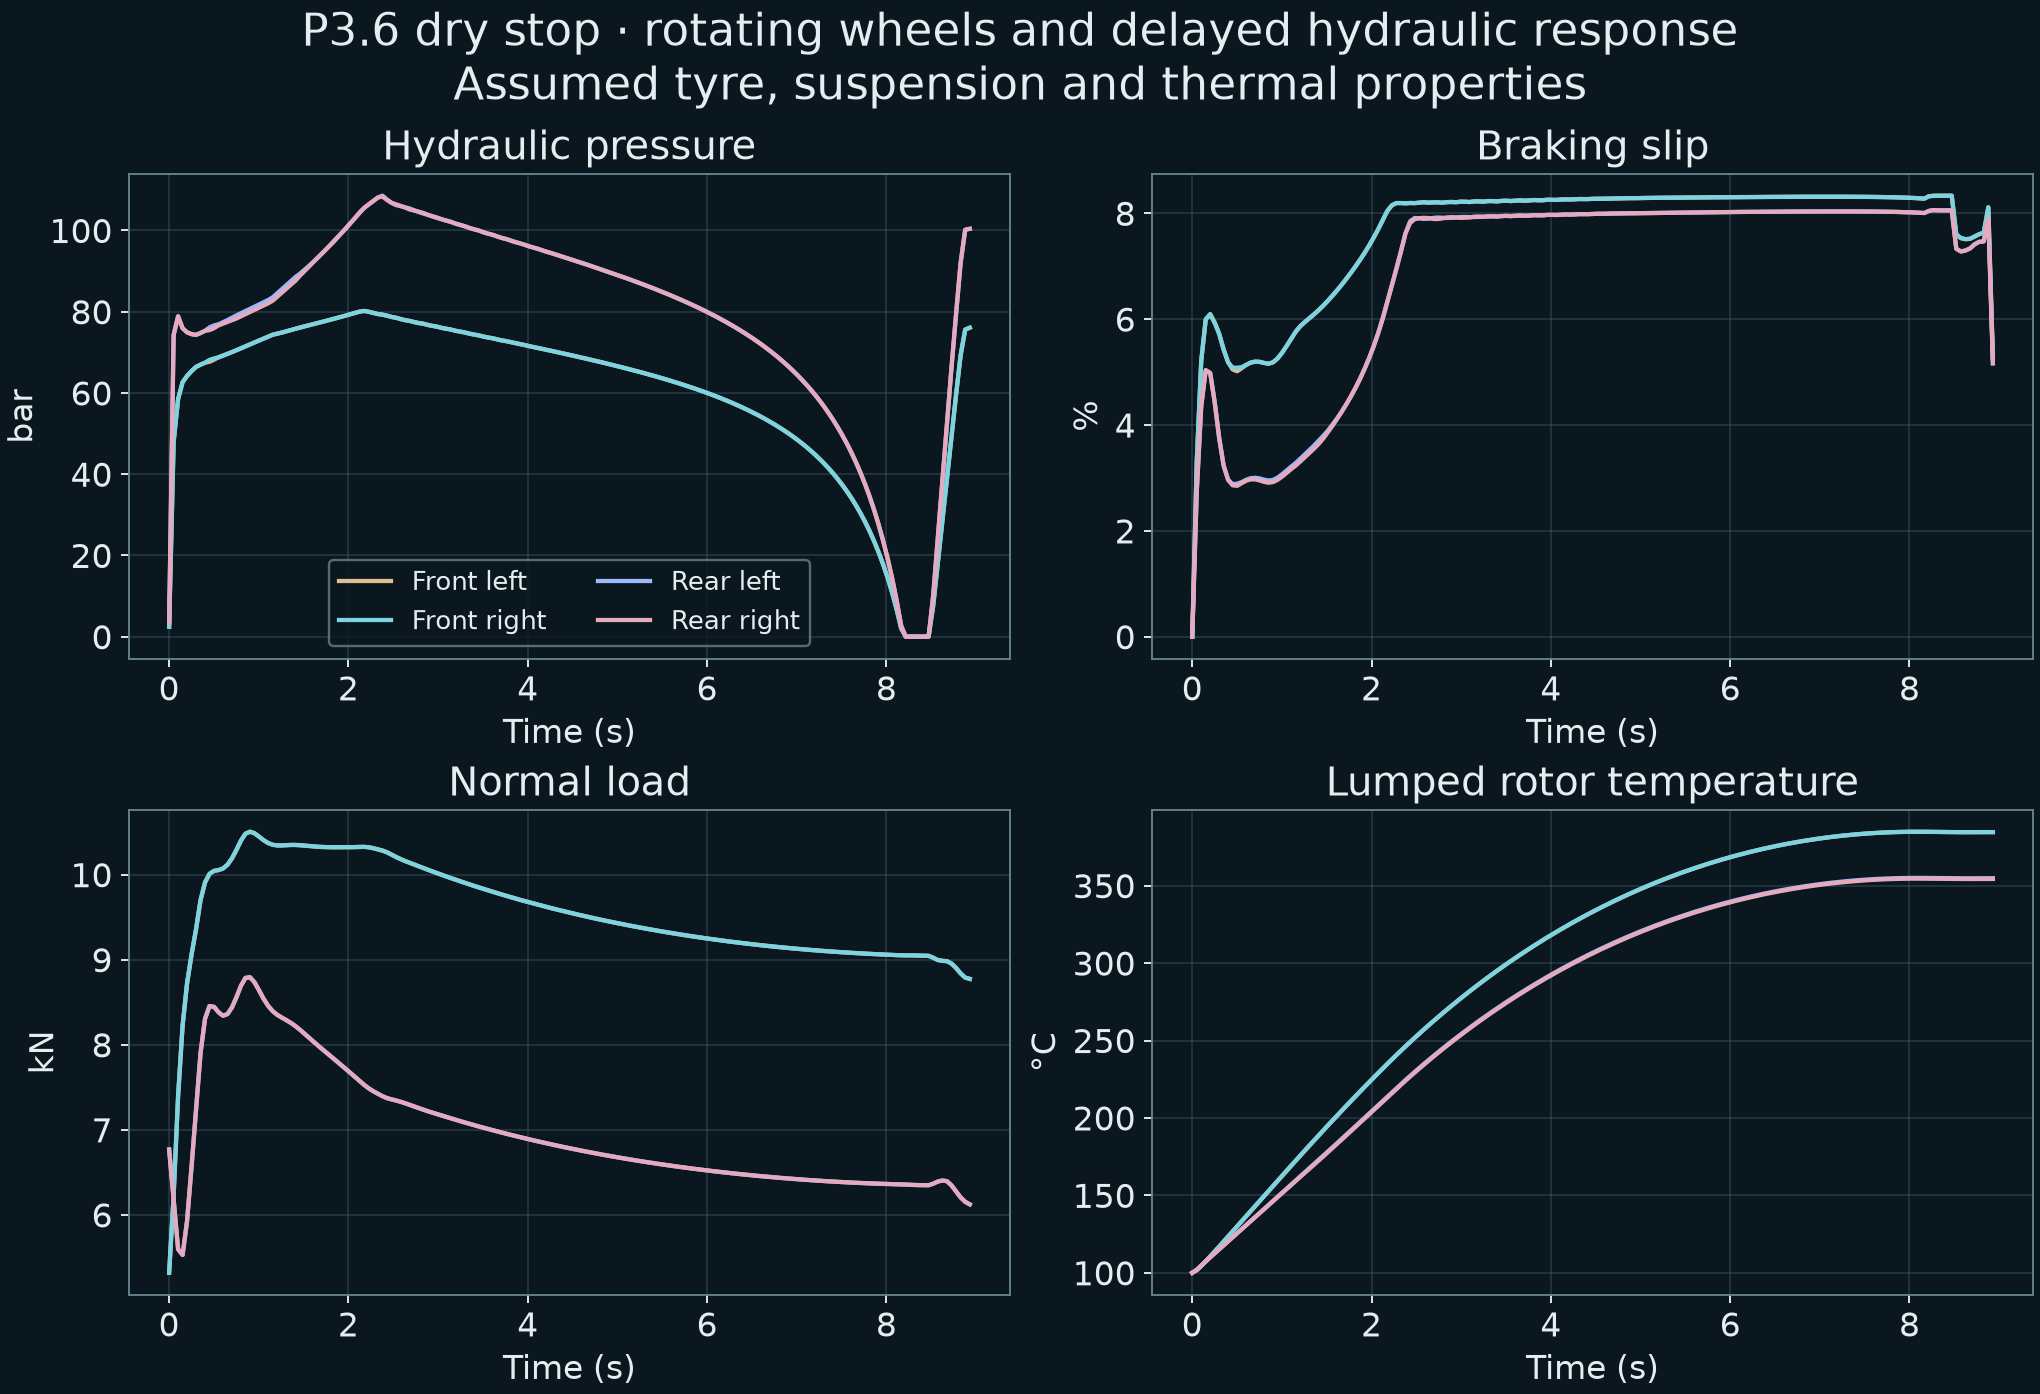
Replay the complete air system enabled and disabled in nine driving conditions. Inspect actual calculated pressure, slip, tyre load and rotor temperature while the car slows.
Same mass, tyres, controller and finite stores at 400 km/h.
Air systems off
Dry straight stop
562.3 mModelled 400–0 km/h stop
400 km/hSpeed
0 barPeak brake pressure
0.0%Peak braking slip
100 °CHottest rotor
0.0 kWUpper fan DC input
0.0 kWWheel regeneration to DC
3.06 MJPulse store remaining
0.00°Heading error
0.00 mLateral position
CryoPulse · air systems operating
Dry straight stop
473.8 mModelled 400–0 km/h stop
400 km/hSpeed
0 barPeak brake pressure
0.0%Peak braking slip
100 °CHottest rotor
0.0 kWUpper fan DC input
0.0 kWWheel regeneration to DC
3.06 MJPulse store remaining
0.00°Heading error
0.00 mLateral position
Follow the wheels
Front leftFront rightRear leftRear right
The path through the stop
Air systems offAir systems operating
Car styling and air paths are illustrations, not CFD. Plots and readouts use recorded model data. The direction test checks the rotated vehicle footprint in a 3.6 m corridor and peak heading below 3°. Grip multipliers describe synthetic conditions; they are not measured snow or ice coefficients.
02 · A more demanding comparison
The benefit survives a stronger model.
473.8 m versus 562.3 m
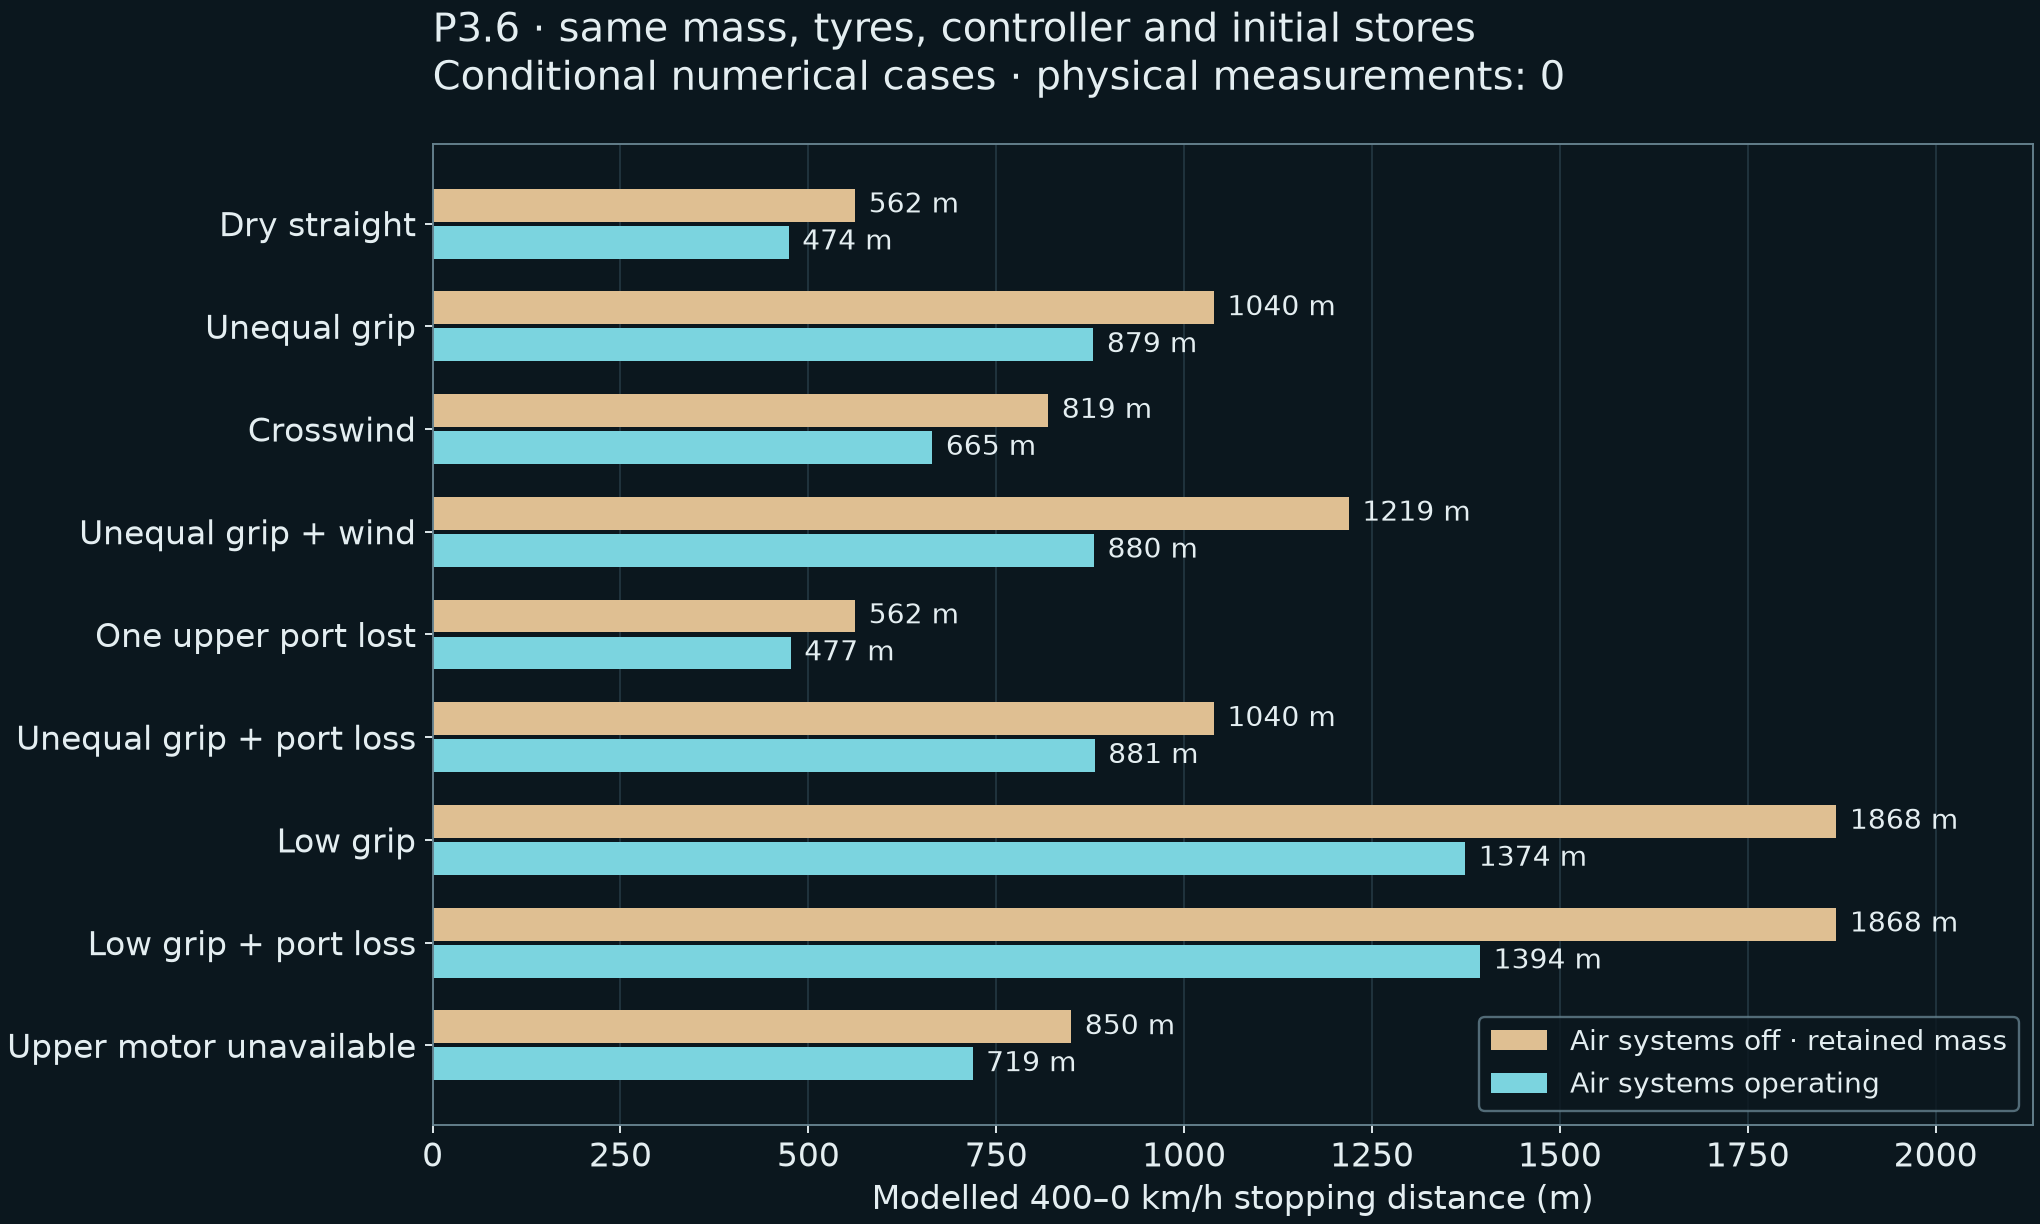
Both cases carry the same 2,464.4 kg, use the same wheel and tyre model, and start braking with the same finite energy stores. Enabling the upper routes and powered underfloor system reduces the dry stop by 15.7% in this model.
P3.5 used ideal wheel-force control and quasistatic load transfer. P3.6 replaces those shortcuts with rotating wheels, a force/slip curve, pressure dynamics and heave, pitch and roll. Its distances are therefore revised. The two revisions are different models.
And the Chiron?
Bugatti publishes 491 m for its Chiron’s 400–0 km/h stop. The present CryoPulse projection is numerically shorter, but its small margin over that measured reference is not independently validated. The earlier baseline fit and assumed component targets do not establish production-car superiority.
Acceleration and unrestricted speed remain earlier, separate longitudinal studies. This revision does not upgrade those projections into a validated whole-vehicle benchmark.
400–0 km/h · matched mass and initial energy · same revised controller
Condition
Air off
Air on
Air-on peak lateral position
Air-on peak heading
Dry straight stop
562.3 m
473.8 m
0.001 m
0.004°
Unequal left/right grip
1039.7 m
879.3 m
0.401 m
1.181°
Crosswind pulse
819.3 m
664.9 m
0.201 m
0.919°
Unequal grip and wind
1219.2 m
880.1 m
0.454 m
1.230°
One upper port lost
562.3 m
476.6 m
0.009 m
0.041°
Unequal grip and port loss
1039.7 m
881.0 m
0.407 m
1.203°
Low-grip straight stop
1867.9 m
1374.1 m
0.000 m
0.000°
Low grip and port loss
1867.9 m
1393.8 m
0.015 m
0.043°
Upper motor unavailable
849.9 m
718.6 m
0.000 m
0.000°
Every nominal comparison is retained. These are synthetic driving cases, not road tests.
03 · Fix, rerun, retain the evidence
Each weakness changes the design.
01
Protect the brake limits.
The first stress batch exceeded a specified brake-power ceiling in some cases. Pressure requests now include a worst-case torque-gain bound and a wheel-speed allowance for grip recovery.
02
Keep control power available.
Other early runs exhausted the pulse budget required for actuation. The controller now protects a 100 kJ control reserve and budgets fan draw over a finite reserve horizon.
03
Account for wheel inertia.
The revised brake command includes a damped allowance for measured wheel deceleration. A half-strength setting improved all three tuning conditions; stronger gains increased distance in the unequal-grip and wind case.
121 computed checks passed after the design was frozen. 89 are development and retained regression cases. 32 are new combined cases. These counts do not estimate a real-world failure probability or prove universal stability.
The controller gets sensor feedback.
Wheel encoders, delayed vehicle-state feedback, pressure and an assumed brake-torque map drive the response. The controller receives no true road-grip value. Its grip estimate remains conservative after saturation; grip recovery is not actively probed.
The model checks contact loss, suspension travel, friction work, brake power, finite stores and the shared electrical node. Halving the timestep changes the selected distances by 0.072% or less.
Airflow still has to earn its place.
The separate pressure study varies upper-outlet backpressure and useful motor output while electrical draw stays unchanged. It retains a braking benefit in the tested combinations, but it is a boundary sensitivity, not a measured installed-flow map.
The tested dry air-on cases span 471.4–480.9 m. The least favourable remains 14.5% shorter than its matched air-off model. Direct network checks at sampled operating points are included in the data.
Tyre curves, sensor response, suspension, rotor properties and thermal coefficients remain design inputs requiring measurement.
04 · The first physical build
Four controlled outlets. Real assembly detail.
Nominal assembled geometry
The missing parts are now in the CAD.
Machined housing. Split valve stubs. Soft seats. Dry bushes. Keyed hubs. Actuator supports. The servomotor shape comes from the manufacturer’s STEP file and mounting drawing.
The bare outlet bore increased to 30 mm to make room for the seat and the real obstruction from the gate and stubs. Its open clear area is 100.7% of the earlier unobstructed reference area. That is a geometric area check; the flow coefficient still has to be measured.
All three sampled rigid poses clear the housing and bushes. The intended elastomer preload is excluded from that check. Leakage, friction, continuous motion, welds and pressure duty remain qualification work.
Hard-anodised aluminium housing; stainless gate and stub assemblies; qualified dry bushes and soft-seat compound. Housing metal mass: 0.702 kg at the assumed density.
Actuation candidate
ROBOTIS XC330
Metal gears, position feedback and supplier CAD. A 250 ms bench stroke is a test target. The quoted 0.93 Nm is stall torque; continuous duty and the car’s 150 ms target remain unqualified.
ATI Nano17 six-axis balance and a dry Sensirion differential-pressure sensor. The complete mounted rig must demonstrate its uncertainty; sensor resolution alone does not establish it.
Put the two candidate blowers, collector, manifold and valves on one balance. An external feed hose can apply pressure forces that look like a duct benefit. Keeping the complete air unit inside the measurement boundary removes that ambiguity.
A parallel pair of 24 V Sanyo Denki blowers is a candidate for the dry-air rig. Each has a 410 Pa catalogue static maximum and a 1.04 m³/min free-flow maximum. They are different operating points. The installed curve must be measured.
Predicted downward reaction from four 30 mm exits at 130°. The assumed flow is an input, not a blower prediction.
Mounted-system expanded force-uncertainty target: 0.02 N. Velocity profiles, outlet pressures and real calibration determine the measured result.
05 · The cold branch, with its hardware costs
Keep the cold idea. Close the full account.
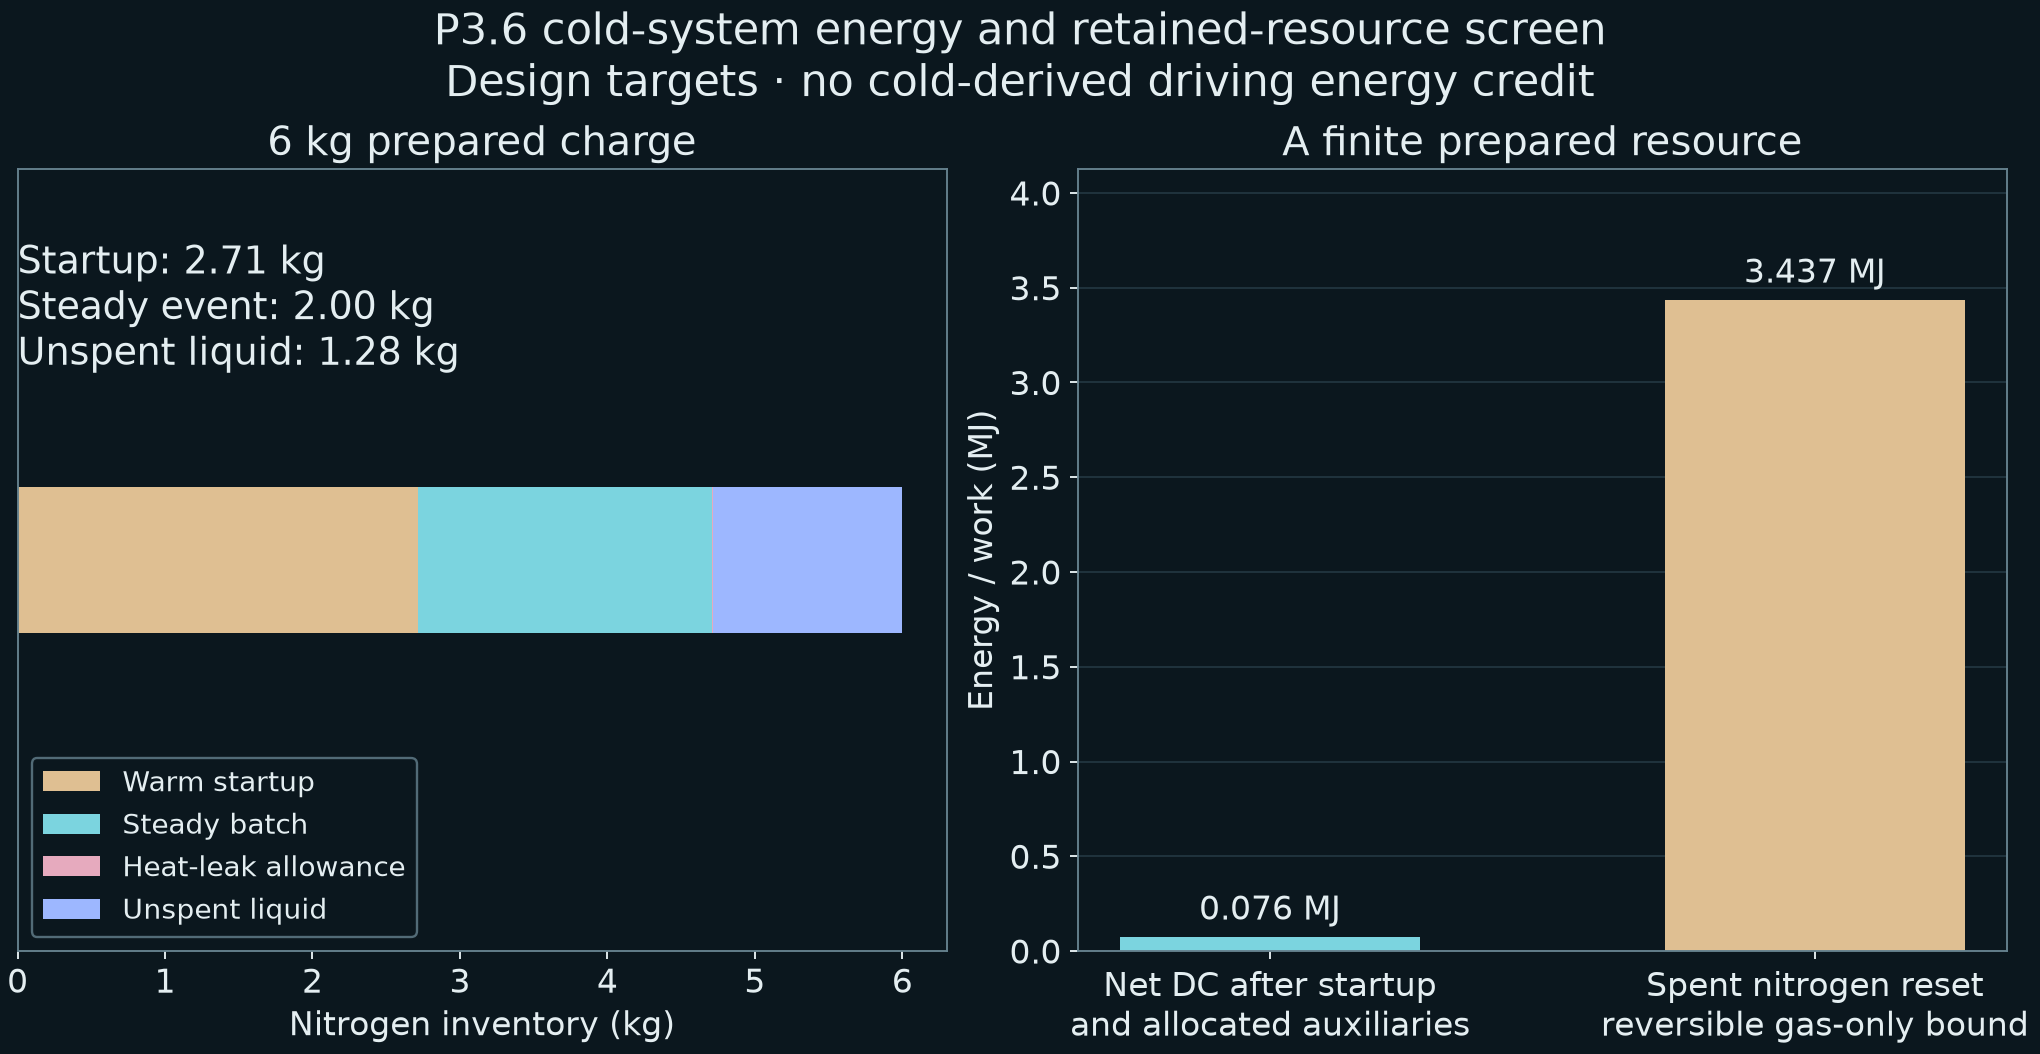
Cooling can create a pressure difference. A prepared cold store can also absorb heat and support a finite recovery cycle. The new screen includes exchanger packaging, warm startup, pressure losses, auxiliary power and added mass.
Prepared liquid nitrogen6.0 kg
Initial inventory target. About 2.71 kg is allocated to warm-hardware cooldown.
Selected steady batch2.0 kg
Finite thermodynamic duty. Two counterflow exchanger targets and real-fluid states.
After startup & allocated auxiliaries76.1 kJ
Calculated DC recovery. Startup pump, control, generator, blower and coolant-pump allowances included.
Driving-model energy credit0 J
The driving results receive no cold-energy boost. Hardware mass is carried in a separate control.
45 kg carried. No energy bonus.
The separate wet-hardware mass target adds 45 kg. Recomputing the earlier acceleration initializer and then the wheel-dynamic stop gives 479.4 m with air systems on, versus 567.0 m off. This sensitivity carries the mass before awarding any unmeasured cold output.
The selected pre-cool bypasses the warm air and coolant streams for a target 120 seconds. It includes the declared wetted masses of both exchangers, piping and the expander, plus startup pump and control input. Heat-transfer coefficients, rib support, pressure drops, startup temperature and equipment masses are targets. This is a packaging and thermodynamic screen, not a fabrication-qualified cryogenic system.
Recovery is not energy creation.
Preparing the full 6.0 kg nitrogen charge has a calculated reversible-work lower bound of 4.45 MJ, already much larger than the selected net electrical recovery. Unspent liquid and residual cold-gas availability are credited separately in the resource ledger. The charge-preparation number is not the amount spent.
The useful questions are heat management, finite power recovery and integration. There is no self-charging or net-energy claim.
Real-fluid calculation with explicit design assumptions. No cryogenic experiment has been performed.
06 · Installed airflow
The body and the ducts have to work together.
The engineering CFD proxy now has moving ground, rotating wheels, wheel arches and an approximate loaded contact footprint. The body’s external shape and internal paths remain part of the same airflow problem.
The repaired open-body steady calculation has reached its planned iteration limit; convergence and refinement checks remain open.
No low-speed CFD coefficient is transferred into the 400 km/h performance model. The full installed fan, upper-outlet and thermal-core interactions are still to be qualified.
What the repaired mesh establishes
The open-body mesh passes the complete topology and geometry checks, including cell connectivity and convexity. Interior-node repairs preserve its CAD surface vertices and triangles.
A mesh check is one stage. Converged forces, mass conservation, wake sampling, wall treatment, refinement and time resolution are separate checks.
Four rotating wheels with a longitudinal slip curve and combined-slip force limit.
Hydraulic pressure buildup, dump response, finite pump power and sensor delays.
Sprung-body heave, pitch and roll with passive spring and damper loads.
Rotor heat capacity, cooling and an assumed fade response.
Revised power protection and damped wheel-inertia feedback.
Detailed nominal bench CAD and a falsifiable first measurement protocol.
What the audit establishes
Wheel, contact, suspension and full-event mechanical-work identities close within their numerical tolerances. The electrical stores remain finite, pressure and power ceilings are checked, and reflection and timestep comparisons are retained.
The tyre model is empirical. Rotor properties are lumped targets. Unsprung vertical motion, coupled ride height and skirt following, a measured tyre-temperature map, structural qualification and installed component maps are absent. Acceleration still uses a separate earlier initializer.
A clean extraction of the archived source rebuilt the wheel solver and reproduced the selected dry distance exactly. The cold account also reran byte for byte. Read the source-reproduction check ↗.
The original P3.6 stress batch passed 41 of 48 sampled plant combinations. Four exceeded a design brake-power ceiling and three exhausted the required pulse actuation budget. Those observations led to the torque-gain bound and protected control reserve. Repeated cases became development checks.
The later inertia-feedback study retained every gain tried, including settings that increased distance in unequal grip and wind. The selected reduced gain is checked on the full regression set and fresh combined cases. None of the retained failures is silently reclassified as success.
Carbon structure, premium brake materials, high-speed tyre development, thermal management and accessible doors remain in the full programme. Supplier technology can inform a target; a brand name does not establish the friction, heat capacity, stiffness or speed rating of this proposed vehicle.
The bench’s 6061-T6 housing and 316L valve components are specific material targets for a low-pressure experiment. Their use does not qualify an installed automotive or cryogenic part.
The first hardware result must close a measured force, flow and electrical balance. The next vehicle model must carry those measurements through acceleration, braking, heat and the available energy together.
This is a developing research programme. Further theoretical testing and physical demonstrations are to come.