Chiron: 2.4 s
A theoretical hypercar programme · P4.3
Could a car out-accelerate,
outrun and out-brake
the Bugatti Chiron?
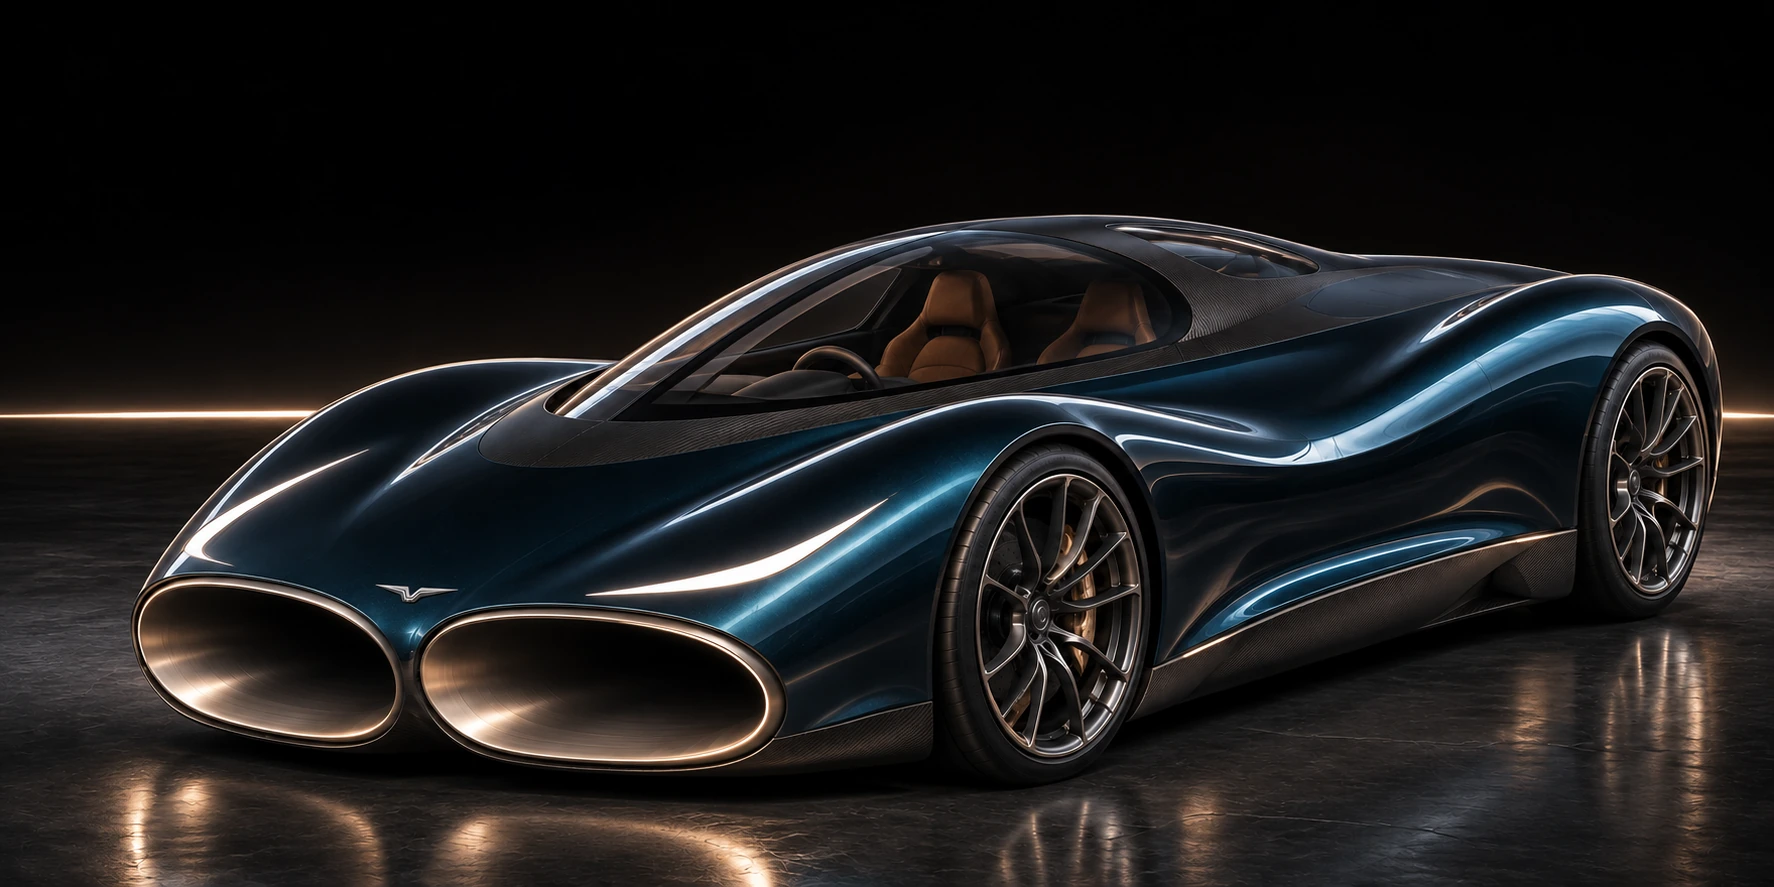
A new performance question. An unmistakable form.
Explore the CryoPulse through-flow hypercar concept.
Theoretical targets. An unbuilt vehicle.
Conditional models and concept imagery. Development continues.
P4.4 / ONE SELECTED DRIVING CONFIGURATION
One build.
One complete run.
Physical tests: 0
Chiron: 32.6 s
Chiron: 491 m
Chiron: 41.96 s
One dry-road assisted launch and stop. Same fitted engine curve. Added mass and precharged electricity counted. The model is slower than the published Chiron over 0–200 and 0–300 km/h; adverse conditions can remove the projected gains. Assumptions & evidence ↗
THE CURRENT LAYOUT / P4.4 IN DEVELOPMENT
Open the car.
See how it fits.
A clear cabin. Protected air paths.
Room for the machinery that makes them work.
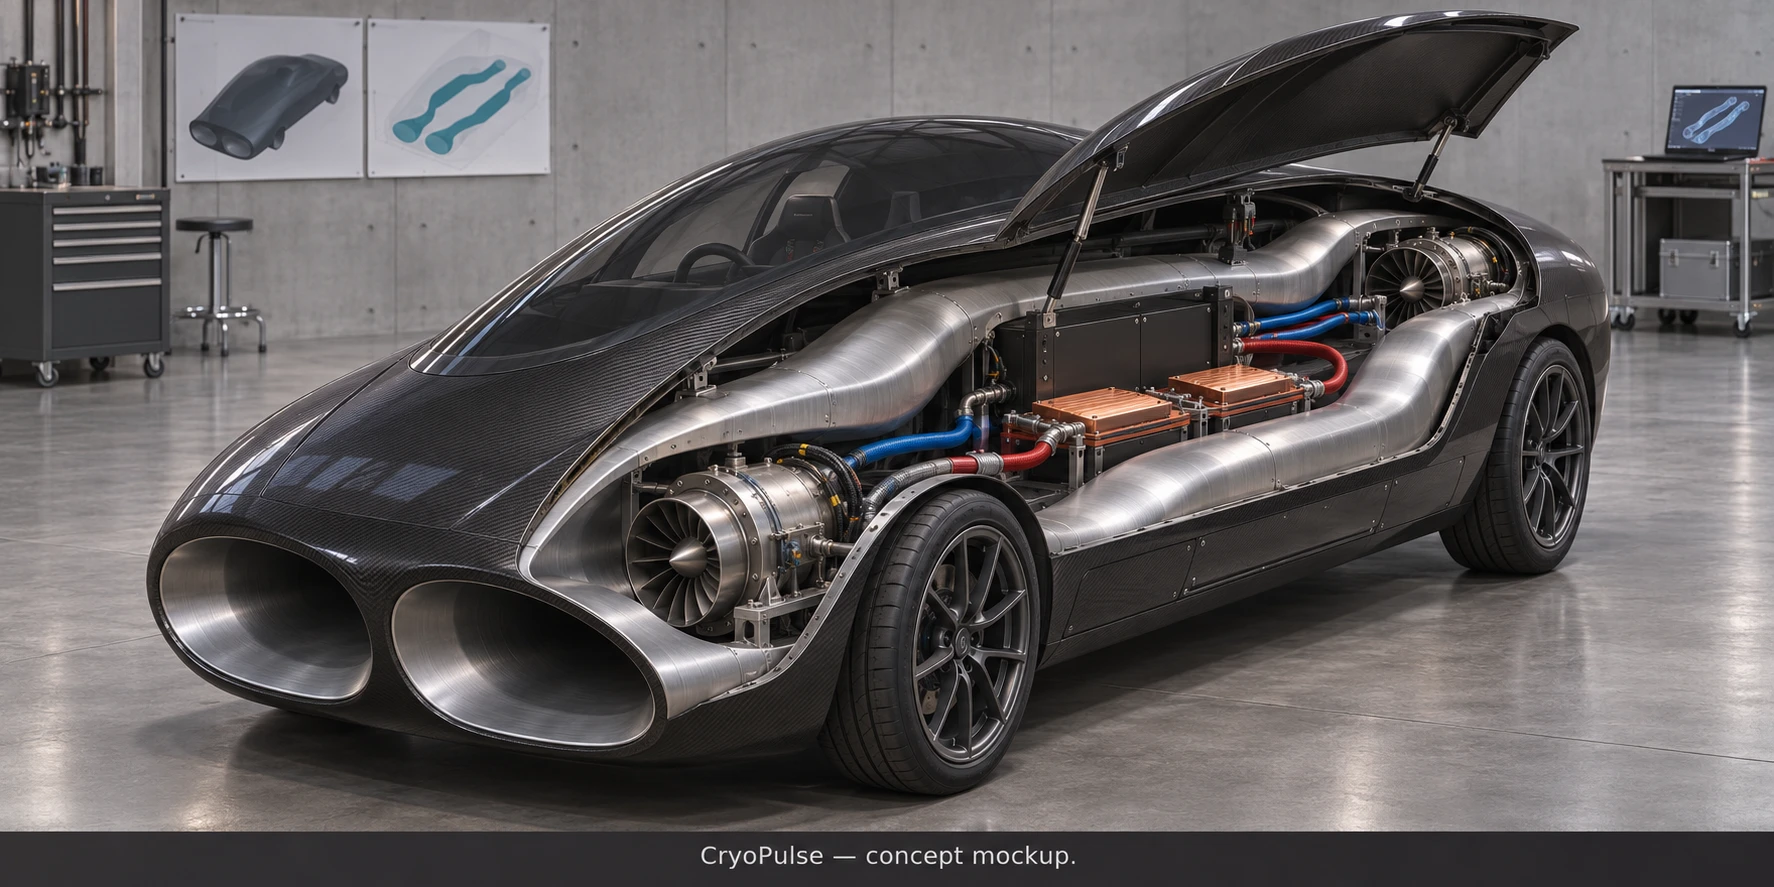
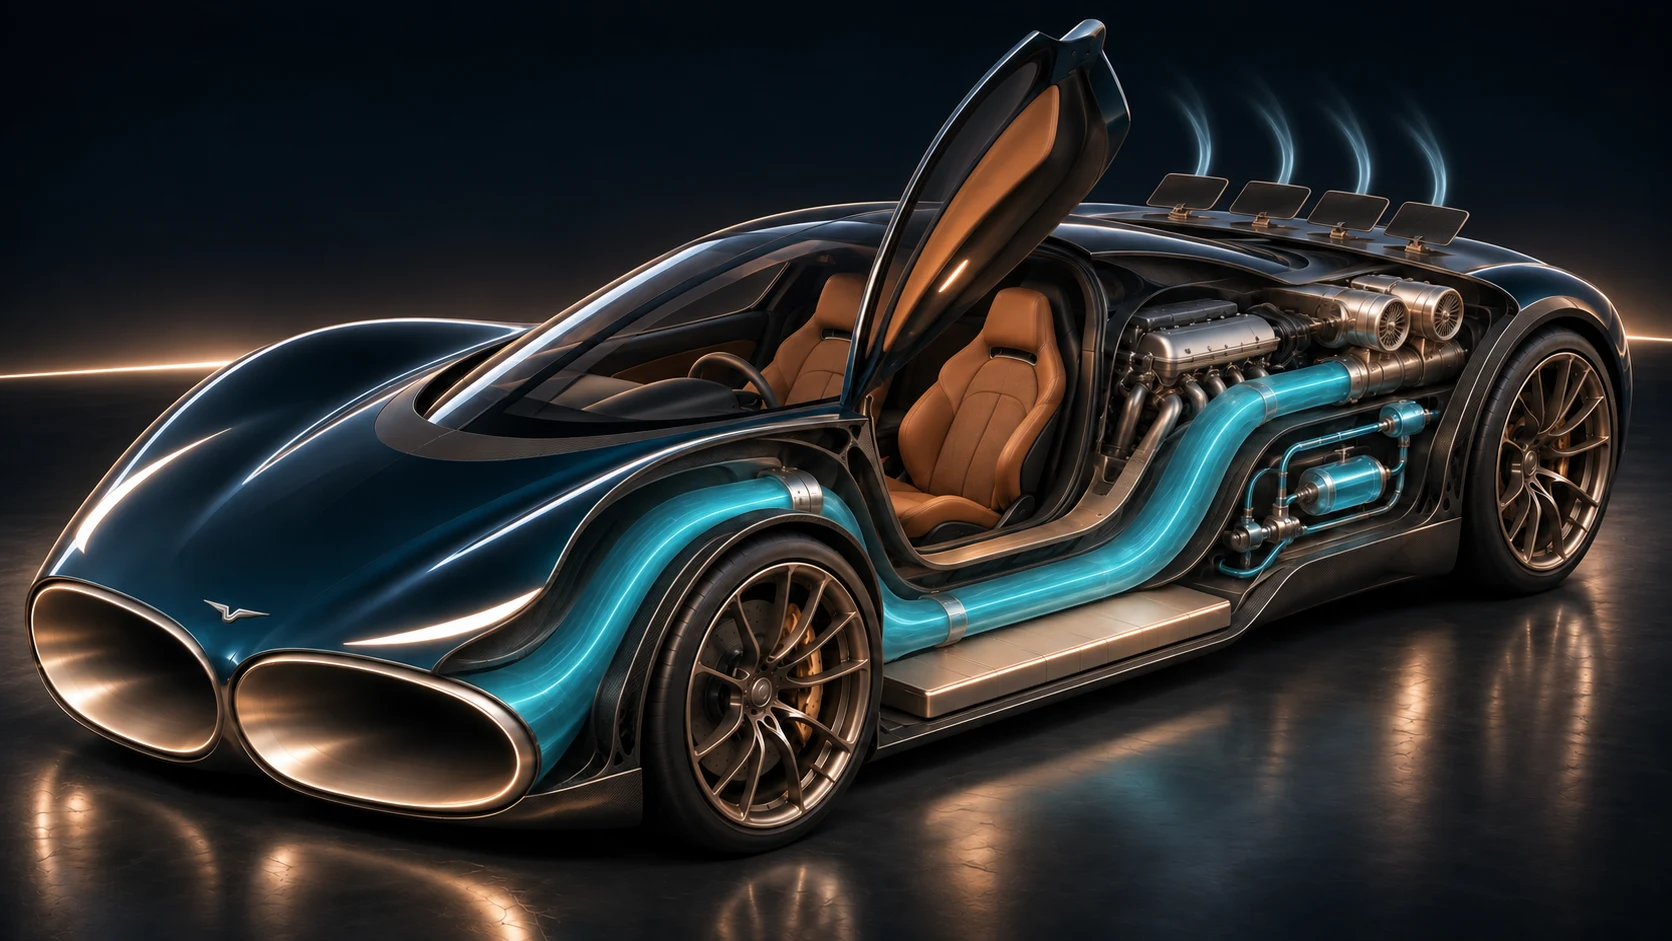 Unbuilt concept illustration
01 / THROUGH THE BODY
Give the air
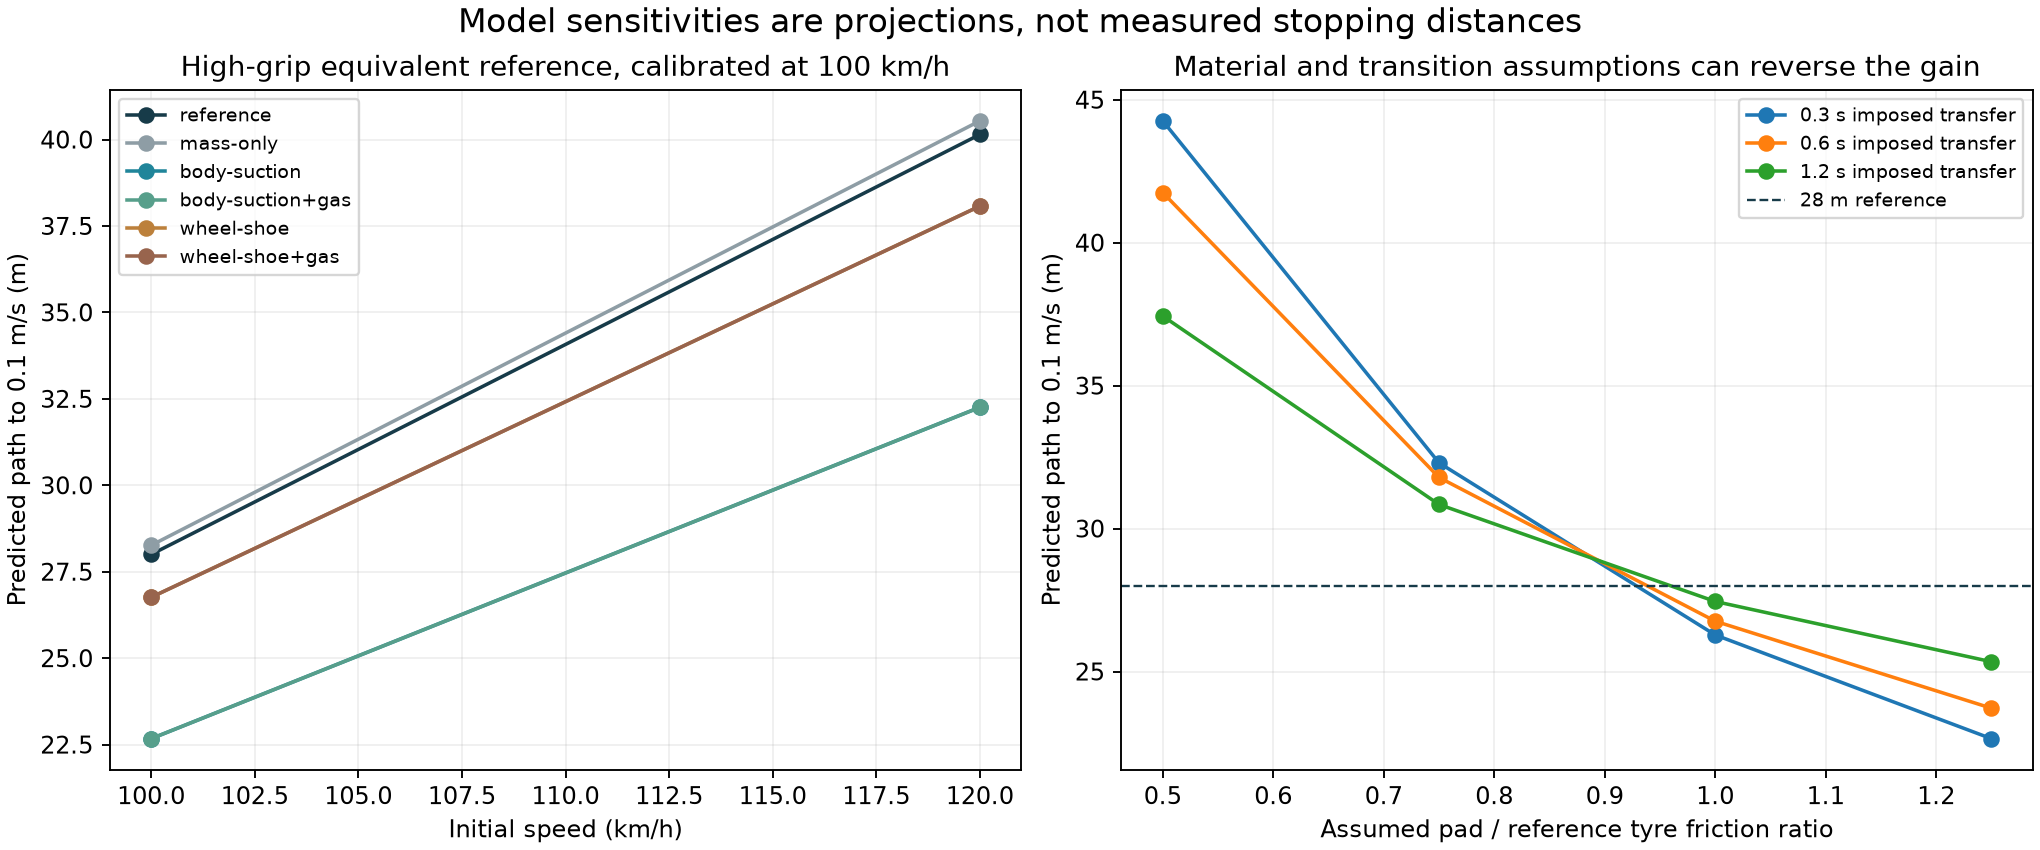
a protected route.
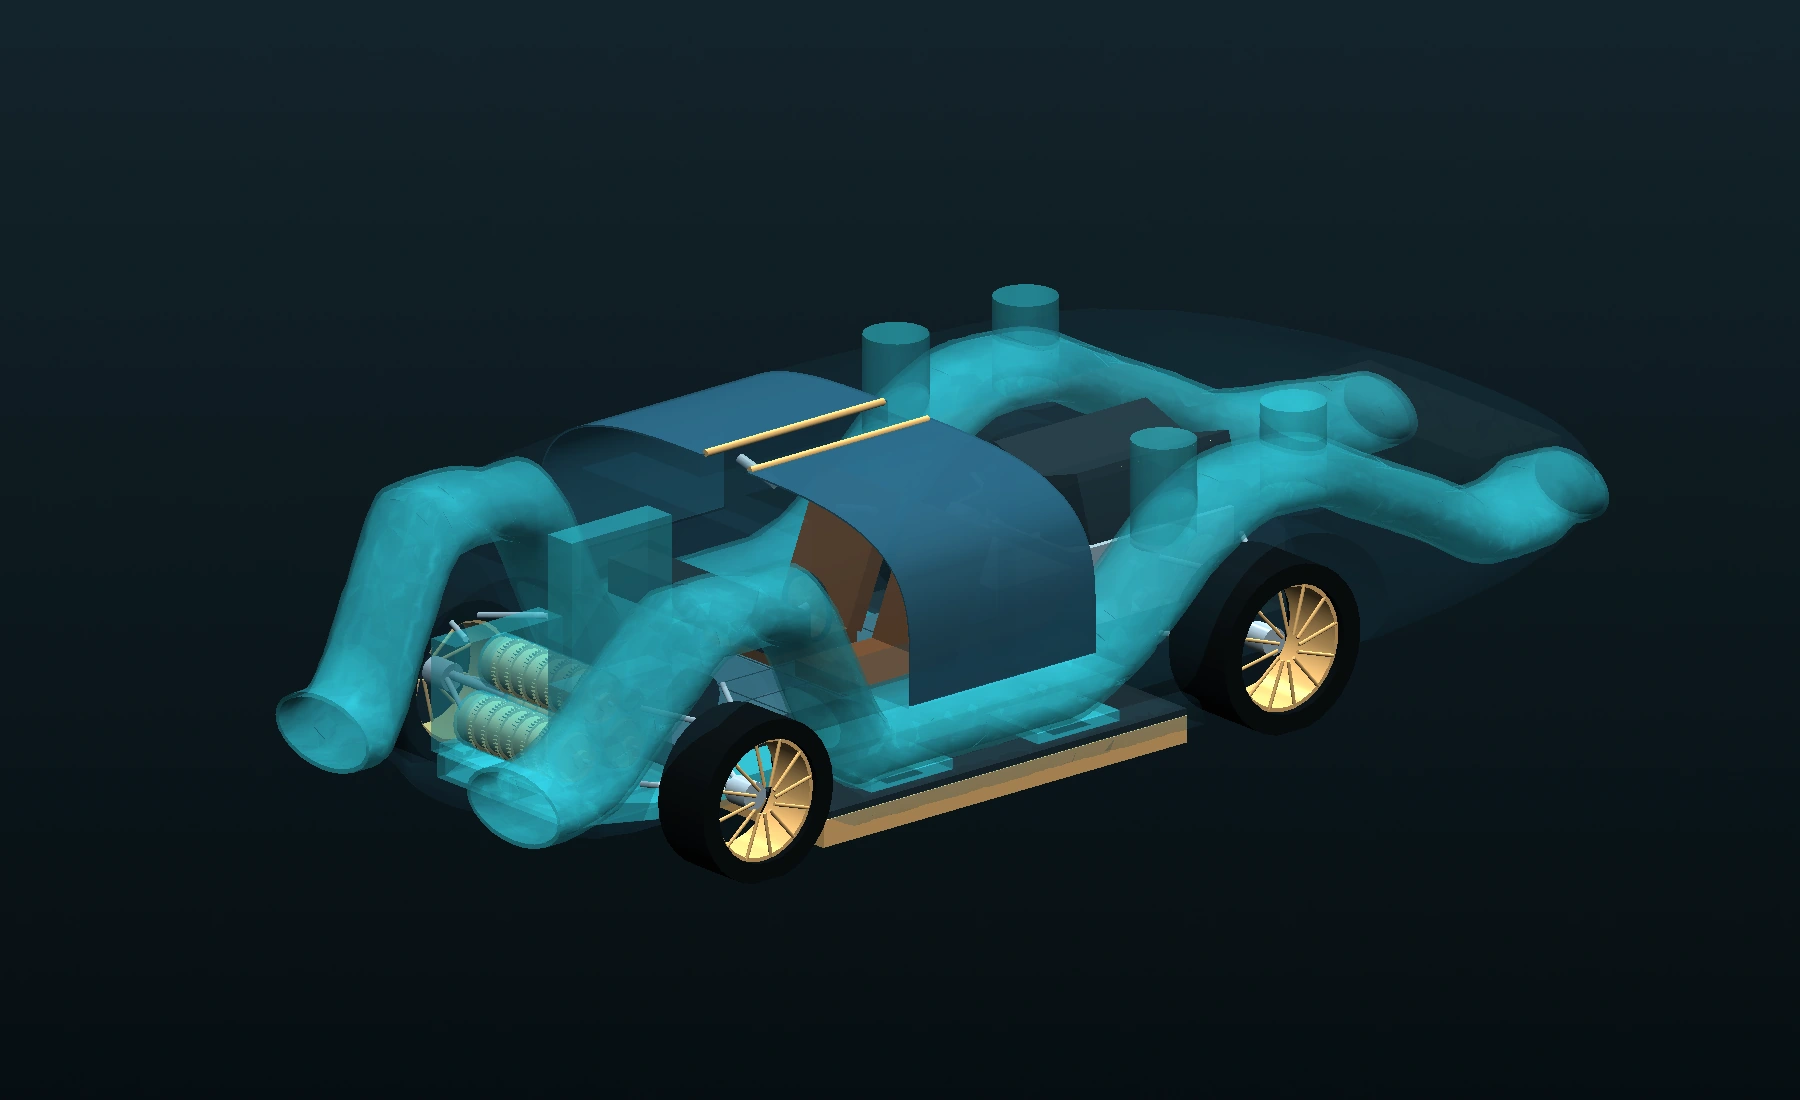
The new layout takes the main passages above the wheel assemblies, then lowers them beside the cabin. The occupied space stays separate from the airflow.
The CAD has a wider body and a longer rear package. P4.4 counts the revised installation mass and air-path targets. A final whole-body drag result is still required.
02 / PRESSURE + CONTACT
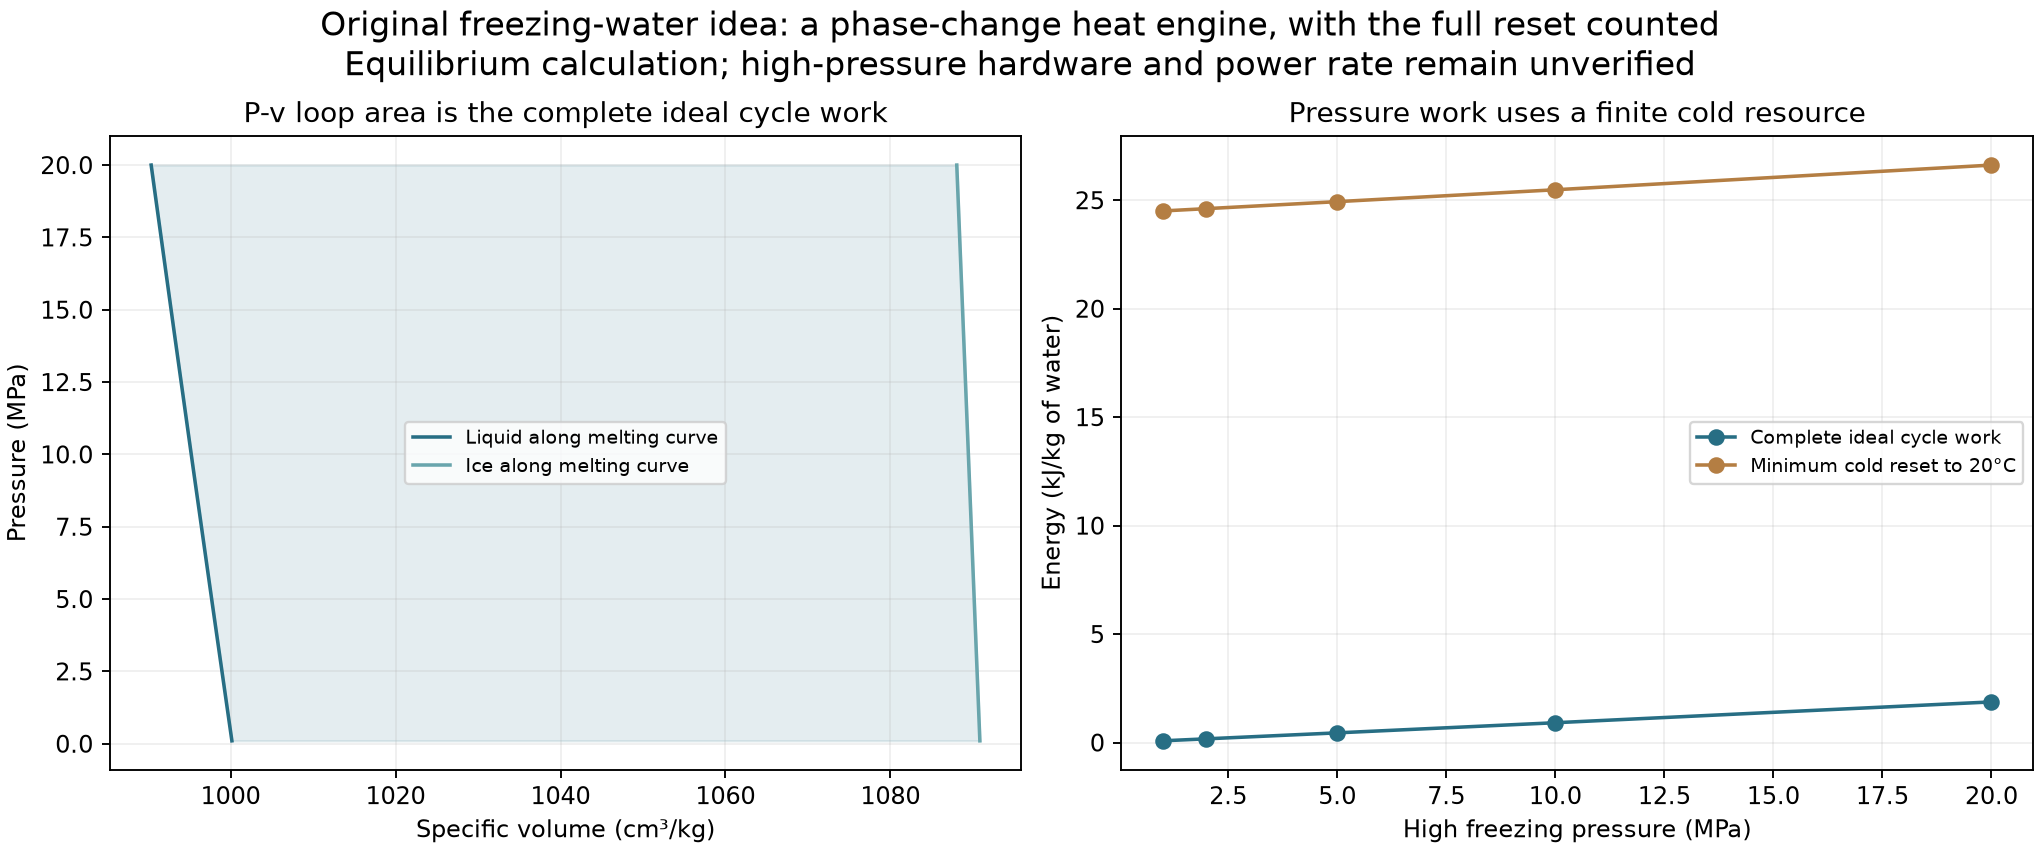
Connect the floor
to its blower.
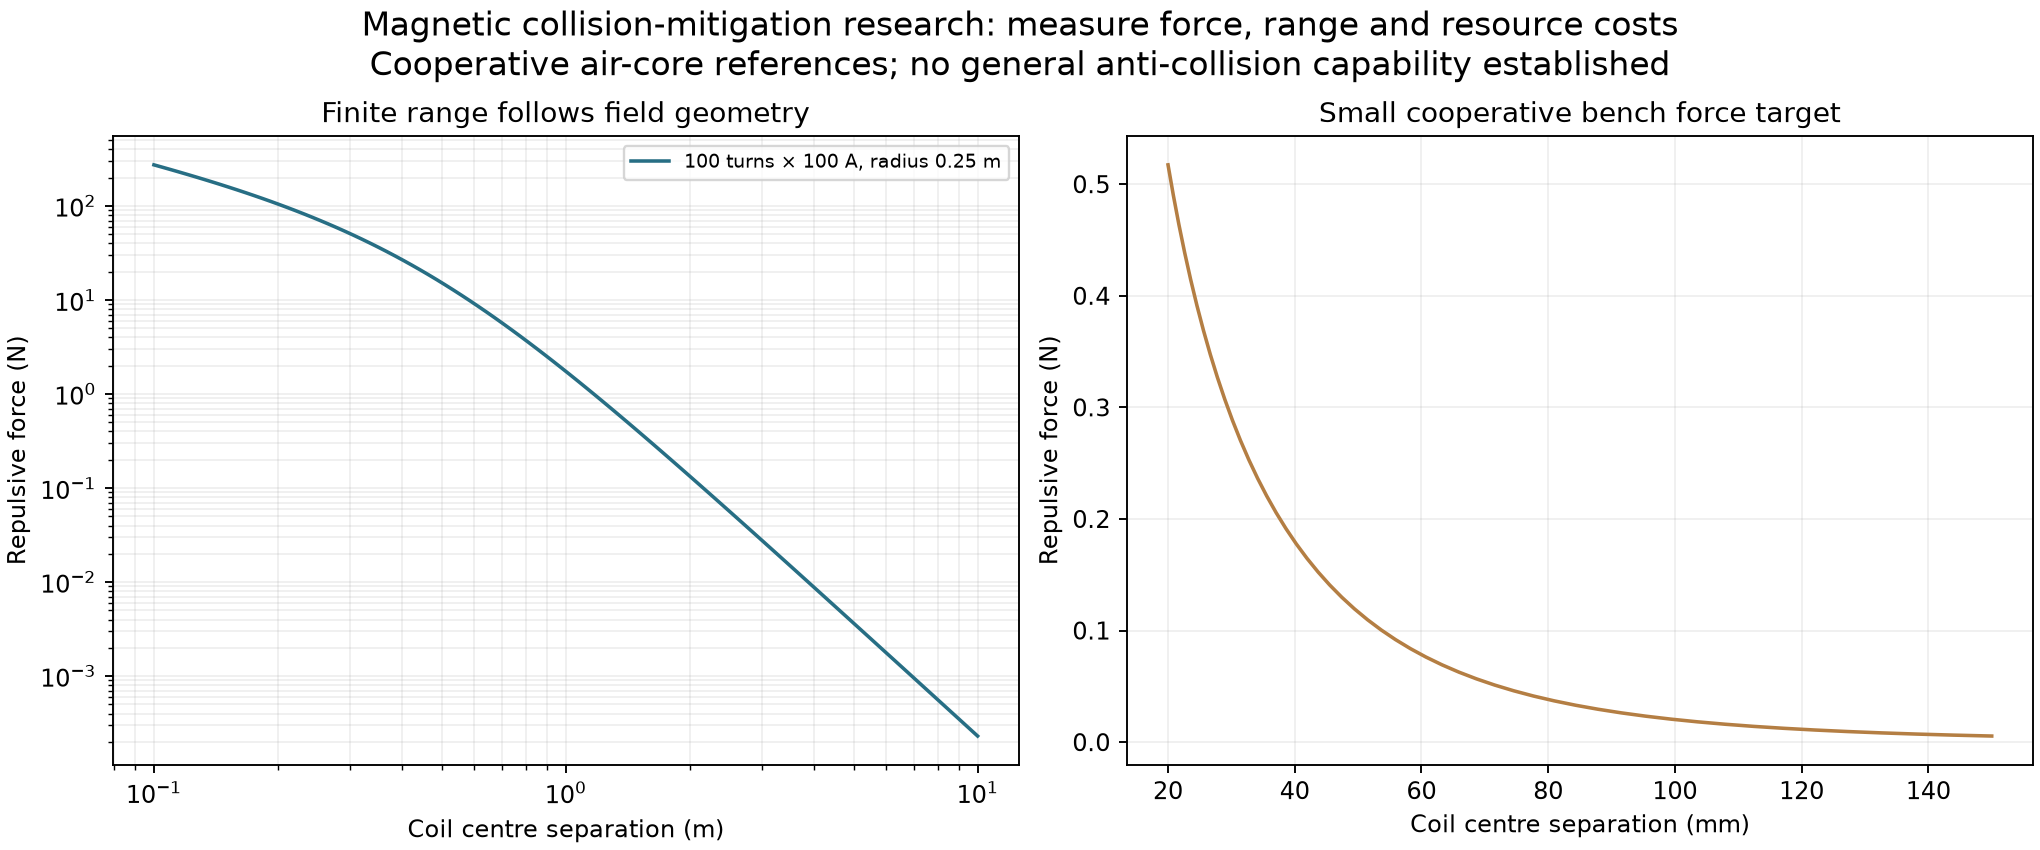
Four cavities connect through straight supported channels to a front cartridge bank. The battery sits above the feeds. Tyres remain on the road.
The selected model carries rotor speed, cavity pressure and energy through preparation, launch and braking. Installed mass, cavity volume and feed losses are counted; their physical maps remain requirements.
03 / THE UPPER VENTS TOO
Send air upward.
Press the car down.
Four upper outlets direct air upward and toward the nose during braking. Their reaction acts downward and rearward, alongside tyre braking and floor pressure.
The banks also need differential control for yaw. Power, startup, angular travel and fault response remain part of the same account.
04 / COLD + ENGINE HEAT
Use a temperature
difference.
The optional rear research package separates prepared cold inventory, pump, hot exchanger and expansion machinery. It is hidden by default in the CAD and excluded from the P4.4 driving score. The cold-flow bench article asks a second, smaller question: does cooling the same core increase mass flow at the same pressure head?
These are distinct tests. Neither turns a pressure deficit into a new energy source, and the same nitrogen inventory is never counted twice.
05 / A CAR YOU CAN ENTER
Open the doors.
Keep the cabin clear.
The cabin and door opening move forward in the new layout. Low side passages sit below the entry, while the propulsion allocation and thermal hardware stay behind it.
Open both rigid door panels to 80° in the CAD. That demonstrates the layout motion; detailed hinges, latches, occupant accommodation and crash structure remain to be qualified.
Actual layout CAD · doors · exploded view · schematic airflow
THE PRESSURE DECK
Carbon sandwich.
Stiffness, support spacing and deflection matter. A material label receives no extra tyre-grip credit.
THE ROTATING PARTS
Aluminium. Steel.
Light rotor blanks, steel shafts and bearing supports. Blade loading and rotor energy are checked separately.
THE OPTIONAL HOT INTERFACE
Nickel alloy.
The separate thermal research model uses IN625 properties. Heat-transfer area, pressure loss, fabrication and startup still require qualification.
This is a development layout and material direction, not a manufacturing release. The concept image is illustrative; the interactive view uses the generated CAD geometry. Further theoretical and physical testing is to come.
P4.4 / THE CURRENT TOP-SPEED PROPOSAL
Proposed top speed.
PROPOSED ASSISTED PEAK
458.8km/h
Reserve the battery during launch. Use a finite wheel-assistance pulse near the engine-only power balance. The source-derived continuous-current limit remains in force.
Conditional scalar model · Temporary peak
Physical top-speed measurements: 0
Time after reaching 400 km/h (seconds)
Selected speed policy Engine-only equilibrium
Air pathBody drag target and through-flow balanceWheel pulseFinite remaining or reserved traction energyContinuous current500 A source-derived envelopeHardware + controlMass, inertia, service draw and protection
This mode’s 0–400 km/h52.22 s
Late traction electricity used8.00 MJ
This is a separate event from the 30.79 s sprint. It uses its own slower launch and the battery left at 400 km/h. No store is reset.
Same fitted effective engine curve. No speed limiter in this screen. The 0.65 m² external drag target, internal-flow loss target, engine extrapolation, installed drive map, gearing, tyres and high-speed stability still require validation. This is a proposed temporary assisted peak, not an established sustainable top speed.
THE CAR AS ONE SYSTEM
Watch it work.
Scroll through the run.
Air, grip, power and braking move together.
P4.4 MODEL REPLAYLaunch
0km/h
Illustrative system routing. Readings follow the saved simulation; these are not CFD streamlines.
01 / THROUGH-FLOW
Air moves through the body.
Two passages carry air around the occupant cell. Powered flow and wheel torque share a finite supply.
2,846 kgWhole-car mass in this model
The scorecard above stays with this one assisted run. Other modes and older builds are in the engineering record.
ACTUAL STEP-DERIVED PACKAGING STUDY
Open the doors.
Follow the passages.
Rotate the model, open the gullwing panels and switch to the upper-duct layout. This packaging CAD is a separate study; it does not validate the driving assumptions.
THE DRIVING SYSTEMS + THE NEXT EXPERIMENT
What the extras do.
How they work together.
Choose a system on the car.
See when it helps and what it costs.
Illustrative system locations on the exterior concept. This view does not establish installed cabin or component clearances.
Finite batteryCold research separateSame engine curve
LAUNCH + BRAKING
Pressure where the tyres need it.
37.5 kNLaunch pressure-load target
The floor blower lowers pressure under four cells. The same tyre law then calculates how the extra normal load changes traction and braking. During the stop, the rotor has to spin up before the pressure arrives.
The installed floor system now has a 150 kg budget, including the front machinery, supported feed channels and collectors. Finite cavity volume, road leakage, capture drag, rotor inertia and power are counted. The installed fan map, road seals and structure require qualification.
Inspect this part of the model ↗EARLY LAUNCH
Air can also provide launch thrust.
0–150 km/hPowered rear-airflow dispatch window
Air drawn through the body is powered and exhausted rearward to create forward reaction. It shares electricity with wheel assistance, so the controller allocates the finite supply between them.
The selected launch spends 703 kJ DC on the rear fan. This powered dispatch ends by 150 km/h; it is not an extra turbine thrust bonus at the proposed top speed. The internal flow map remains unmeasured.
Inspect this part of the model ↗ASSISTED ACCELERATION
Wheel torque shares the supply.
6.36 MJAdded traction shaft work in the selected launch
The fitted engine curve stays the same. Finite electrical wheel assistance adds shaft work through a torque-limited drive and reduction, while the rear fan and pressure floor compete for the same bus.
That shaft work costs 7.13 MJ DC. The 125 kg drive budget, reduction, inertia and losses are included. The current envelope comes from the manufacturer's 500 A RMS continuous-current curve, with a conservative loaded-bus voltage bound. Installed motor and cooling maps still need qualification.
Inspect this part of the model ↗BRAKING + YAW TRIM
Brake with air and the tyres.
140°Nominal braking reaction angle
The upper outlets send air upward and forward, giving the body a downward and rearward reaction. That joins tyre braking, floor pressure, wheel regeneration and the steering/yaw controller in the same stop.
Upper fan electricity is 1.40 MJ in the nominal stop. Actual banks stay within 110–150° and their rate limits. Detected split grip or a port fault returns the mean toward 130° to retain differential authority. Plumes and installed hardware need qualification.
Inspect this part of the model ↗OUTSIDE THIS DRIVING SCORE
Put cold flow on a bench.
CF-1.1Separate research demonstrator
The first cold-flow article compares the same copper channel at 20°C and 0°C. It has native CAD, four probe allocations, a fixed twelve-pair schedule and analysis for future instrument data.
The 64 kg dry nitrogen-stage candidate and six-kilogram liquid inventory are outside the selected driving build. A finite recovery calculation is useful research; an added vehicle module must still justify its mass and complete energy cost. Hardware measurements remain zero.
Inspect this part of the model ↗ACROSS THE COMPLETE RUN
Coordinate the whole sequence.
46Declared simulation challenges passed
Delayed wheel, pressure and battery estimates feed braking, steering, pressure control and energy supervision. Upper-rotor startup receives the power left after priority loads, and optional launch assistance is cut when the reserve is threatened.
Wheel recovery returns 0.86 MJ DC during the selected stop. Reserve targets, sensor delays, actuator work and bus limits remain in the account. The sampled checks are numerical evidence, not experimental statistics or a vehicle safety certification.
Inspect this part of the model ↗THE LATEST ADJUSTMENTS
Small changes.
A connected result.
Half the preparation time.
A steeper counted ramp replaces the eight-second target. Peak startup power rises; it still has to pass the motor and battery limits.
Coordinate each bank.
More rearward reaction in the nominal stop, while each bank retains its own travel limit. Fault control changes the mean to preserve yaw authority.
Size for the motor peak.
The final shaft study covers peak torque and a branch imbalance. The front floor system now has a 150 kg installed allowance, including its feeds, collectors and support requirements.
The driving result credits the floor, powered air paths, finite wheel assistance and adaptive controls. The cold demonstrator is a separate research programme. Active-camber grip gains, wheel deployment during driving, general magnetic anti-collision and freezing-pressure propulsion remain outside this selected performance claim.
THE MODELED ADVANTAGE / ORIGINAL CHIRON BENCHMARK
Show the distance.
See the difference.
34.3 mshorter in the nominal model
Model speed400 km/h
13.4%Shorter 0–100 time
5.5%Shorter 0–400 time
7.0%Shorter stopping distance
8.6%Shorter 0–400–0 time
These percentages compare the selected CryoPulse simulation with Bugatti’s published original Chiron figures. They are conditional projected differences, not measured improvements or statistical significance. Only the CryoPulse marker follows a simulated trace; the Chiron marker shows its published 491 m endpoint.
Published benchmark ↗THE NEW LAYOUT / P4.4
Air has a route.
Wheels have room.
22 mmFeed-to-main-duct clearance
In the checked nominal geometry
In the checked nominal geometry
30 mmPack mounting-height change
Included in the mass distribution
Included in the mass distribution
500 ASource-derived continuous-current envelope
Installed drive qualification still required
Installed drive qualification still required
Keep the passage open.
Straight feed trunks and short transverse branches preserve the required passage area after the proposed walls and supports are counted. Their losses remain a testable target.
See the section areas ↗Carry the same stores.
The run includes a precharged 16 MJ chemical and 12.8 MJ DC exchange window. Fan startup, wheel assistance, heat and recovery share the main-pack account. Controls also have a separate finite reserve.
Follow the energy account ↗Start with a specific test.
The copper-channel prototype isolates the cooling question. It separates flow and electrical measurements from the calculated heat balance, before any vehicle benefit is claimed.
Open the visual laboratory ↗This is a conditional engineering model and a developing layout, with zero hardware measurements. Aerodynamics, tyre behaviour, installed machinery maps, cooling, structural joints and complete vehicle safety still require design and qualification. What remains ↗
THE CRYOPULSE DESIGN STUDY
Sculpted for the air.
Tailored for the driver.
Deep petrol blue. Champagne titanium. Cognac leather and a charcoal textile cabin. A proposed design language that brings the wider architecture into view.
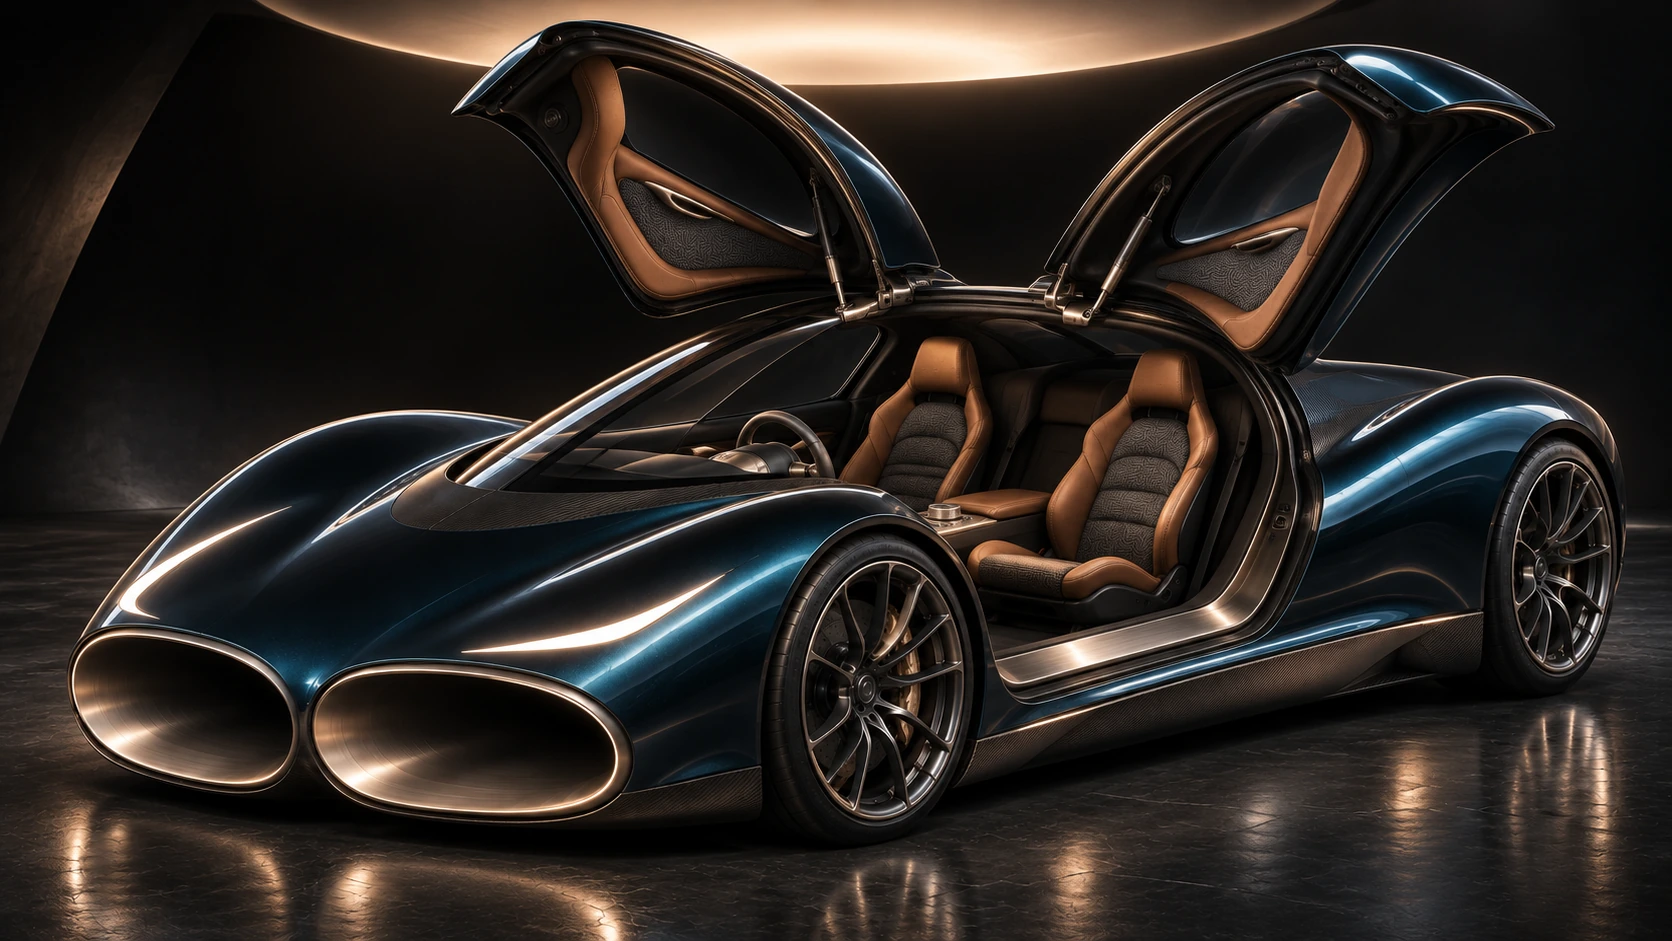
01 / ARRIVALAn entrance worthy
An entrance worthy
of the idea.
Roof-hinged doors rise above the cabin. The proposed interior sits between the two airflow corridors, bringing the passenger space into the design.
Open the actual layout CAD ↗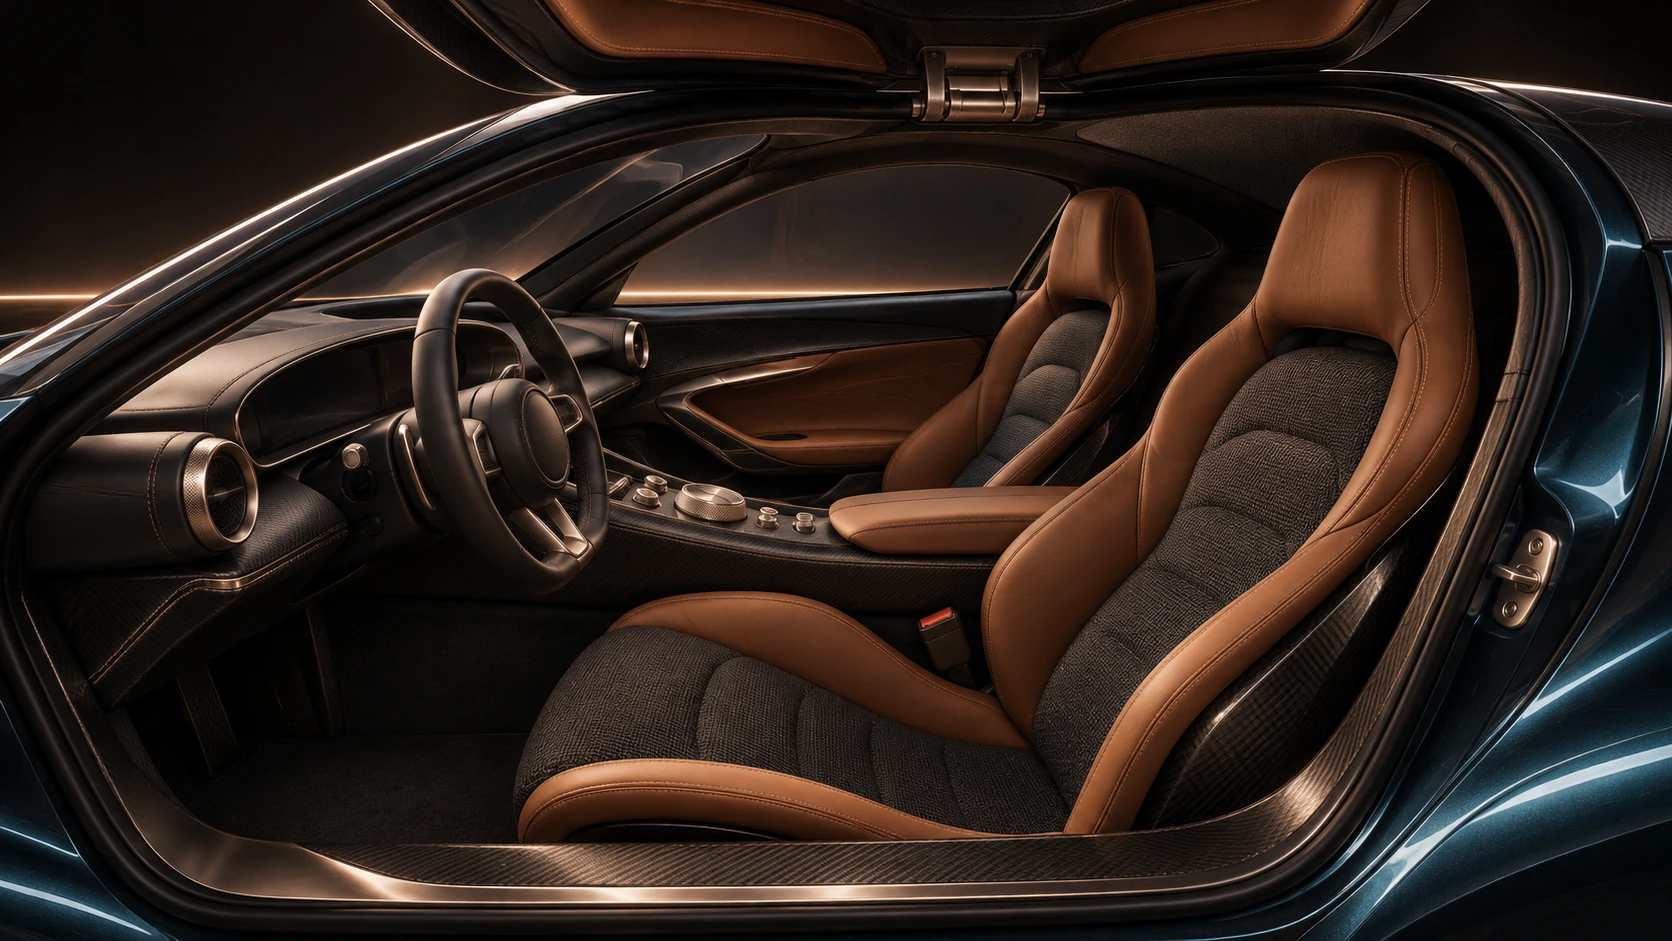
02 / ATMOSPHEREPerformance you see.
Performance you see.
Craft you can imagine.
Tactile woven seat centres. Sculpted leather bolsters. Satin carbon and precise metal controls. A luxury material direction for the next stage of the cabin design.
Final material selection and ergonomics are part of the next design stage.
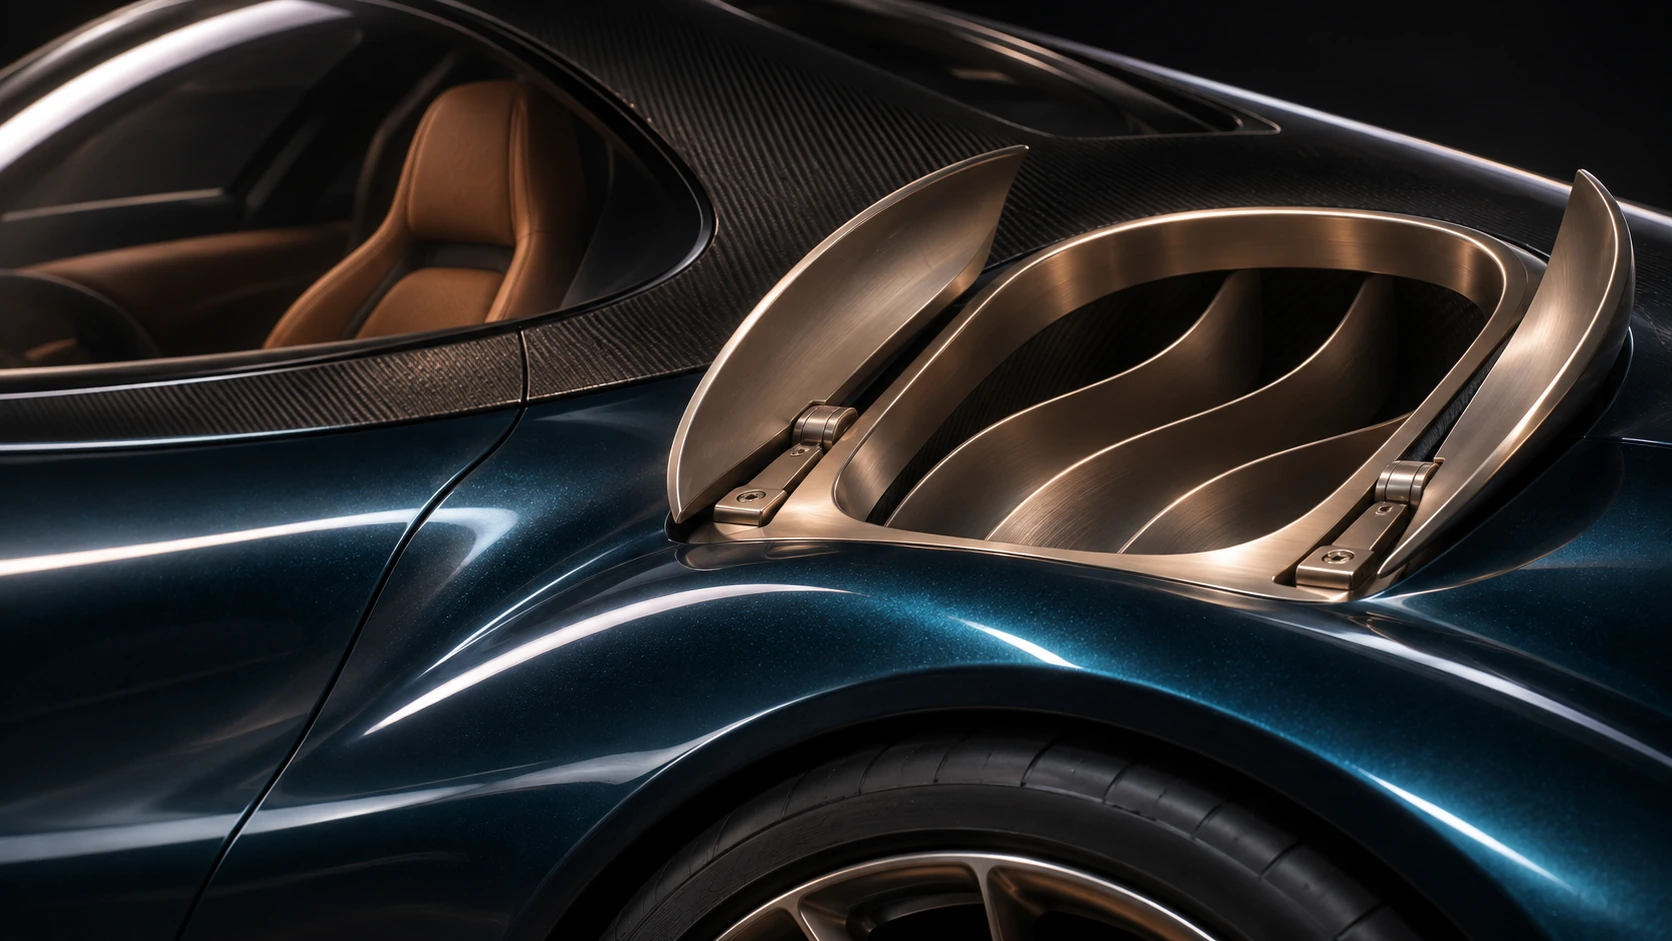
03 / AIR IN MOTIONAir becomes
Air becomes
part of the architecture.
The proposed braking route sends captured air upward to create a downward reaction. Covered outlets are intended to close for the speed mode. Their final shapes, mechanisms and losses still need engineering validation.
Follow the illustrated airflow ↗Petrol blue / champagne titanium / cognac. Proposed styling and materials. Explore the opening-door packaging study in the CAD view.
THE BUILD DECISIONS / P4.4
Build the driving system.
Test the cold-flow idea.
Air, grip and finite power.
- Rolling tyres and ordinary steering
- Protected passages through the body
- Pressure floor and upper braking outlets
- Source-derived 500 A drive envelope
- One carried battery through launch and stop
46 computational challenge cases. Hardware measurements: 0. The installed maps and complete vehicle still require qualification.
Does cooling increase flow?
- One dimensioned copper channel
- The same measured pressure head
- 20°C and 0°C wall conditions
- Twelve paired thermal blocks
- Flow and electrical input recorded
CF-1.1 is a design for laboratory fabrication review. A positive result would support this flow effect under its measured conditions.
Explore the bench prototype ↗Every addition earns its place.
- The heavier nitrogen-stage research option
- Unmeasured tyre-material grip gains
- Wheel deployment while driving
- General magnetic collision protection
- Freezing-pressure or unbudgeted energy
The original ideas remain in the research record. They receive no unearned performance credit in the selected build.
ERROR → FIX → CHECK
See what changed.
See why it changed.
The tyre entered the duct space.
Fix: Raise the front air path over the sampled steering sweep. Keep the floor channels inboard and add four short branches behind the front wheels.
Small component budgets missed the connections.
Fix: Include a 150 kg floor-system allowance, supported channels, collectors and a raised pack mount. Feed their mass and centroids back into the same run.
Peak power alone hid the current limit.
Fix: Use the manufacturer's current grid and the 500 A continuous inverter envelope, with the loaded battery voltage and a finite energy window.
A finer time step caught reverse shaft work.
Fix: Record the brief housing-relative reverse work as launch-clutch heat. Three time-step checks close the mechanical and electrical ledgers.
THE CRYOPULSE HYPOTHESIS
Build the car around
the air moving through it.
Then test the full performance question: can the architecture improve launch, high-speed stopping and useful energy recovery?
The braking proposition
Powered underfloor suction could add tyre load while the wheels keep steering. Ducts, cooling and trajectory control are developed as one architecture.
The thermal power stage
Pump liquid nitrogen, add engine heat, then expand it in two stages. The generator, pump, blower and cold inventory share the same account.
The current performance case combines these paths in one conditional model. Hardware performance still needs measurement.
Through the body.
Into the performance question.
Air is a working medium.
Every proposed benefit has a cost to measure.
Illustrative routes with proposed upward braking outlets. Not CFD streamlines.
Route the air.
Paired ducts curve around the occupant cell. A rotor may extract power or consume power in a different operating mode. Its pressure drop and drag belong in the same energy ledger.
AIR IN → DUCT → ROTOR → AIR OUT
Through-flow changes where losses occur. It does not make drag disappear.
Earlier P2.2 braking comparison
EARLIER P2.2 BRAKING STUDY / RETAINED FOR REVIEW
The earlier braking study.
Kept open for review.
This earlier powered-suction study projected a shorter high-speed stop, if the assumed fan, seal, tyre and control performance can be achieved.
This is only the beginning. Further tests are coming.
This braking study is a small part of the wider CryoPulse system. Further theoretical testing is to come, including whether the through-flow architecture can reduce total aerodynamic losses and improve efficiency or attainable speed.
The bigger picture and upcoming research ↗Earlier P2.2 comparison: braking subsystem only.
Powered suction, rolling tyres, added mass and an assumed braking/control envelope feed these figures. These earlier figures remain unchanged. The new P3.2 performance case, upward ducts and finite-store calculations appear above.
See the complete twelve-part programme ↗Initial speedkm/h → 0
Bugatti ChironPublished stopping distance491.0 m
CryoPulseConditional model prediction427.9 m
63.1 m
shorter in this model
12.9% conditional reduction at 400 km/h
Distances exclude driver reaction. Published reference and a model projection are different kinds of evidence.
Where the headline weakens
Seal sensitivity. At 400 km/h, a 3 mm assumed gap gives 479.4 m. Fan unavailable with added mass gives 503.3 m, longer than the published 491 m benchmark.
Control limit. The 400 km/h curved-path stress case fails for both models. It is excluded from improvement claims. Brake heat, tyre limits and installed airflow remain unverified.
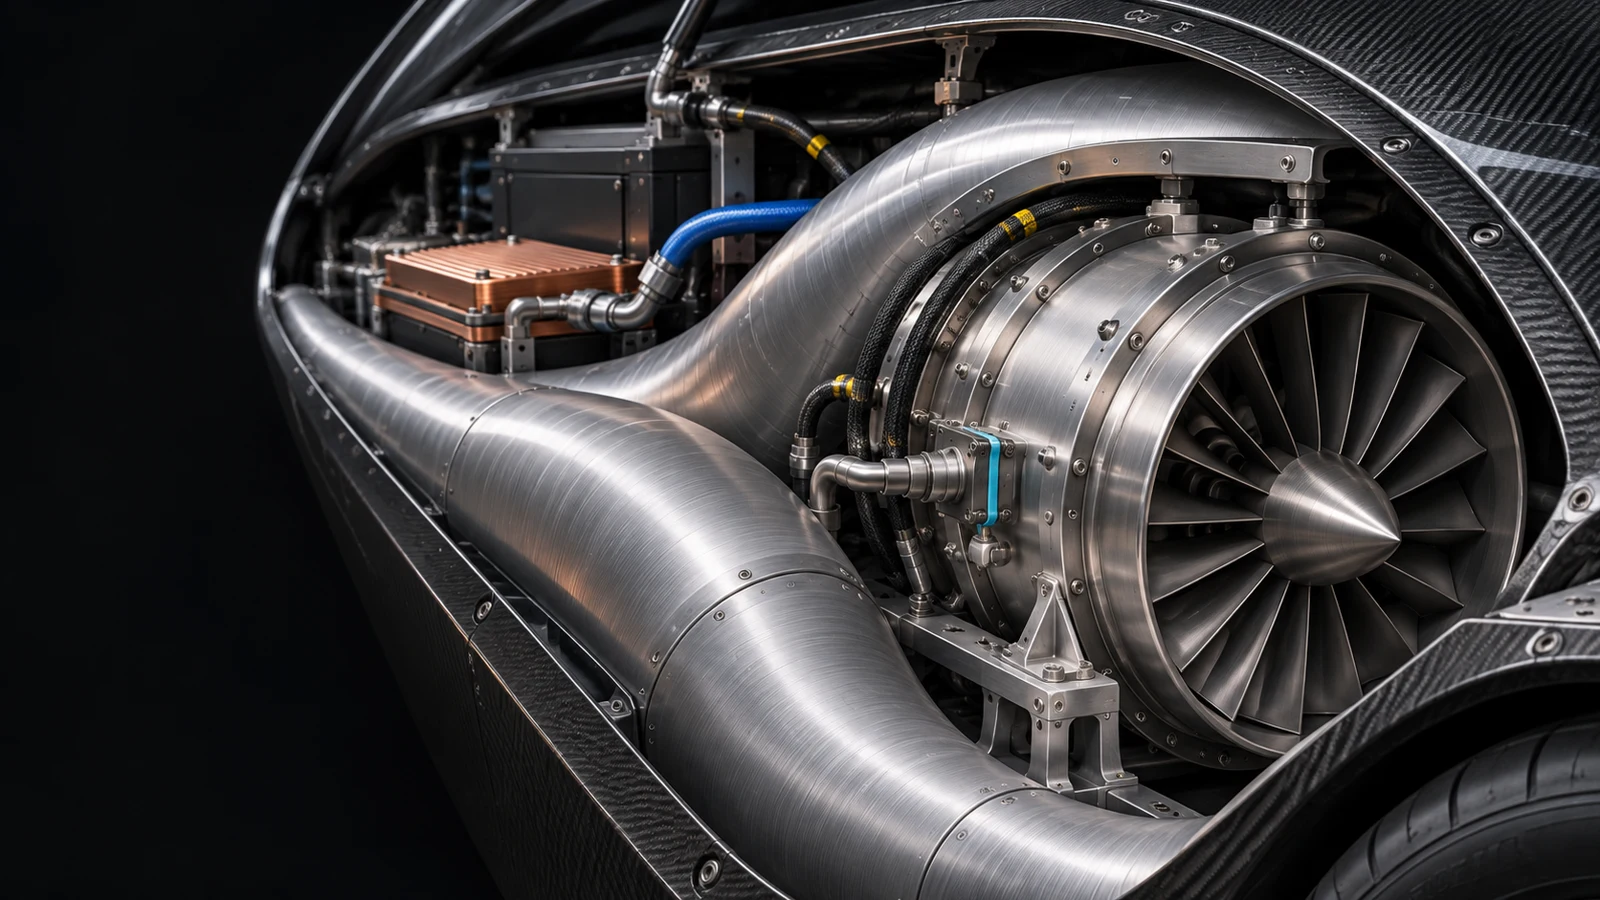
Designed around
the whole system.
Carbon structure. Smooth metal ducts. Qualified seals, bearings and thermal interfaces. Material choices follow measured loads and temperatures.
Proposed system detail. Materials and components remain to be qualified.
Earlier engineering simulator and CAD
INSIDE THE RESEARCH PROTOTYPE
Inspect the earlier P2.2 engineering.
The geometry is real CAD. The calculations are reproducible models. The hardware still has to be built and tested.
The pressure path follows the operating mode.
Loading embedded CAD…
A pressure deficit is something we can test.
Cooling lowers the pressure of a finite gas inventory. Ambient air then creates a normal load over a sealed footprint. The wall must cool, the ice bath supplies finite cold, and leakage refills the gas.
p = mR / (Vc/Tg + Va/Ta)F = (pa − p) AeffWload = ∫ Fload dxStopping distance only counts with control.
A generic high-performance reference is calibrated to a published 28 m stop from 100 km/h. This is not a digital twin of that car. Fan, seal, mass and grip inputs remain assumed; both vehicles receive the same ideal control knowledge.
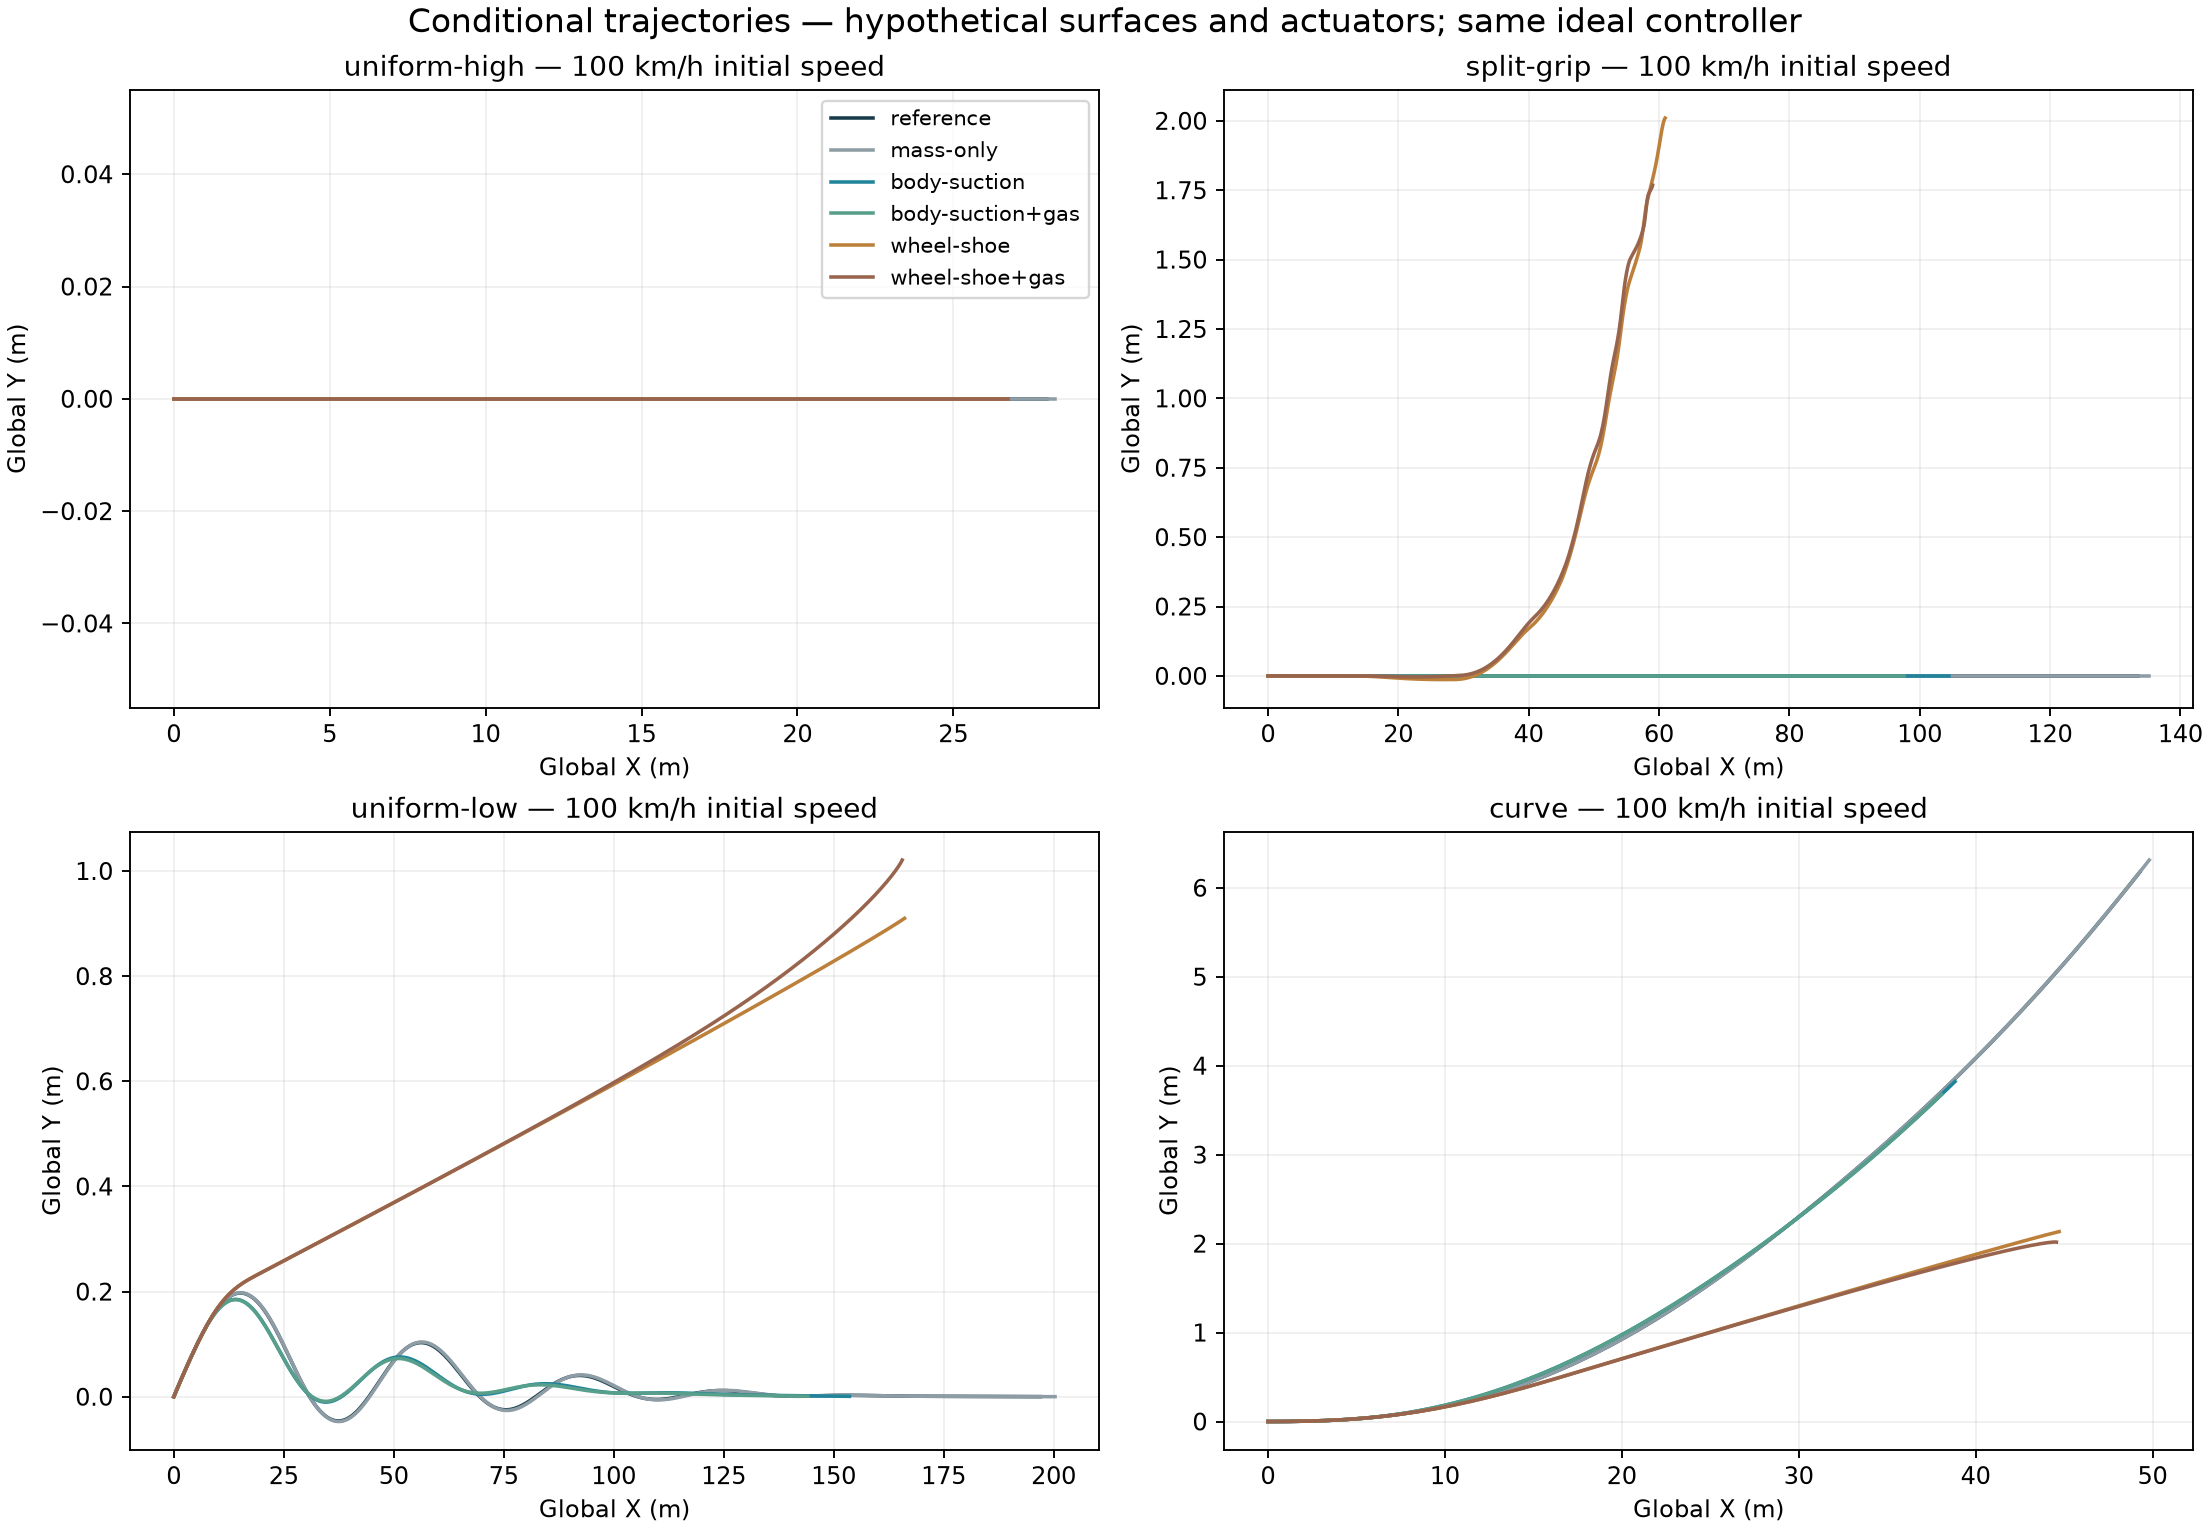
Map uses equal distance scales. The vehicle marker is enlarged on long paths. Dark grey: reference. Teal: selected projection. Amber: fails example stability limits.
Full work-package record and removed concepts
The complete programme.
Clear decisions for each part.
The original plan is retained as a research record. The rolling build selects the useful routes and removes unsupported performance claims.
WP 1Body and duct co-design
Treat the inlet, internal path, occupant cell and outlet as one shape. Compare external and internal losses together.
WP 2AirDrive: heat and flow
Measure installed rotor performance, pressure drop, cooling and the balance between generator and powered-fan modes.
WP 3Ground-effect braking
Qualify the fan, four pressure cells and real-road seals while retaining rolling tyre contact.
WP 4Road and trajectory control
Adapt braking to available grip, estimated path and weather. Straightness and stopping distance are assessed together.
WP 5Pulse stores and distribution
Account for the power electronics, transient supply, mass and energy needed to activate each mode.
WP 6Suspension and contact
Develop contact control, magnetic actuation and hydraulics. Verify locks and support before stationary wheel reconfiguration.
WP 7Recovery and storage
Keep recovery separate from generation. Include conversion losses, finite stores and recharge costs.
WP 8Cryogenic routing
Model finite cold, nitrogen handling and thermal interfaces. A temperature difference is a resource to budget.
WP 9Freezing-water pressure
Test a controlled freezing pressure cycle against phase-change thermodynamics, containment and reset energy.
WP 10Cooperative magnetism
Study matched magnetic systems and their force envelope. No general-purpose magnetic anti-collision claim is established.
WP 11Joint controls and failures
Coordinate pressure, thermal, wheel and trajectory modes. Retain adverse and failed cases in the results.
WP 12Research and manufacturer review
Bring the assumptions, evidence, CAD and experiment into one reviewable dossier before claiming vehicle performance.
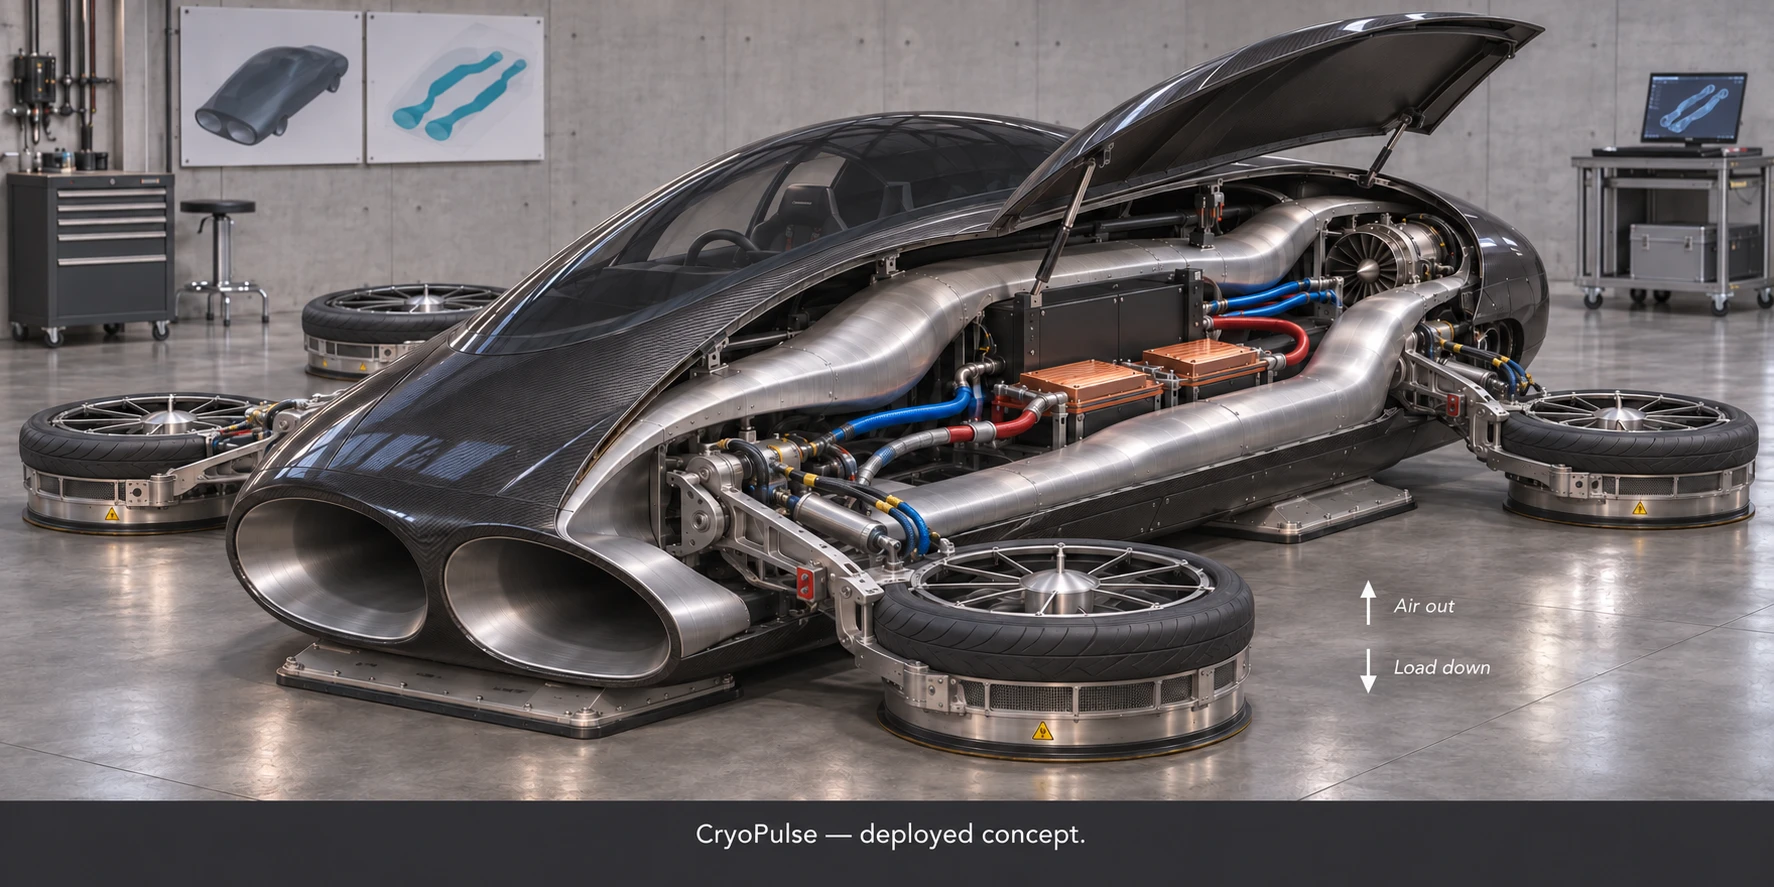
A route we removed
from the rolling build.
Outward-turning wheel fans remain a stationary packaging study. The selected driving model keeps road-wheel contact and uses body-mounted pressure and vent systems.
Inspect the complete research record ↗Original technical review: 39 research sections
Physics, assumptions, failures and the next proof.
39 detailed sections preserve the original plan and connect each result to its scope. The numerical checks establish consistency of the calculations; the experiment specification defines the next physical evidence.
01CryoPulse P2.2 - overnight research prototype
Scientific mechanisms, engineering layout, conditional vehicle projections and a first experimental design. Prepared 11 November 2026. All twelve original work packages are retained.
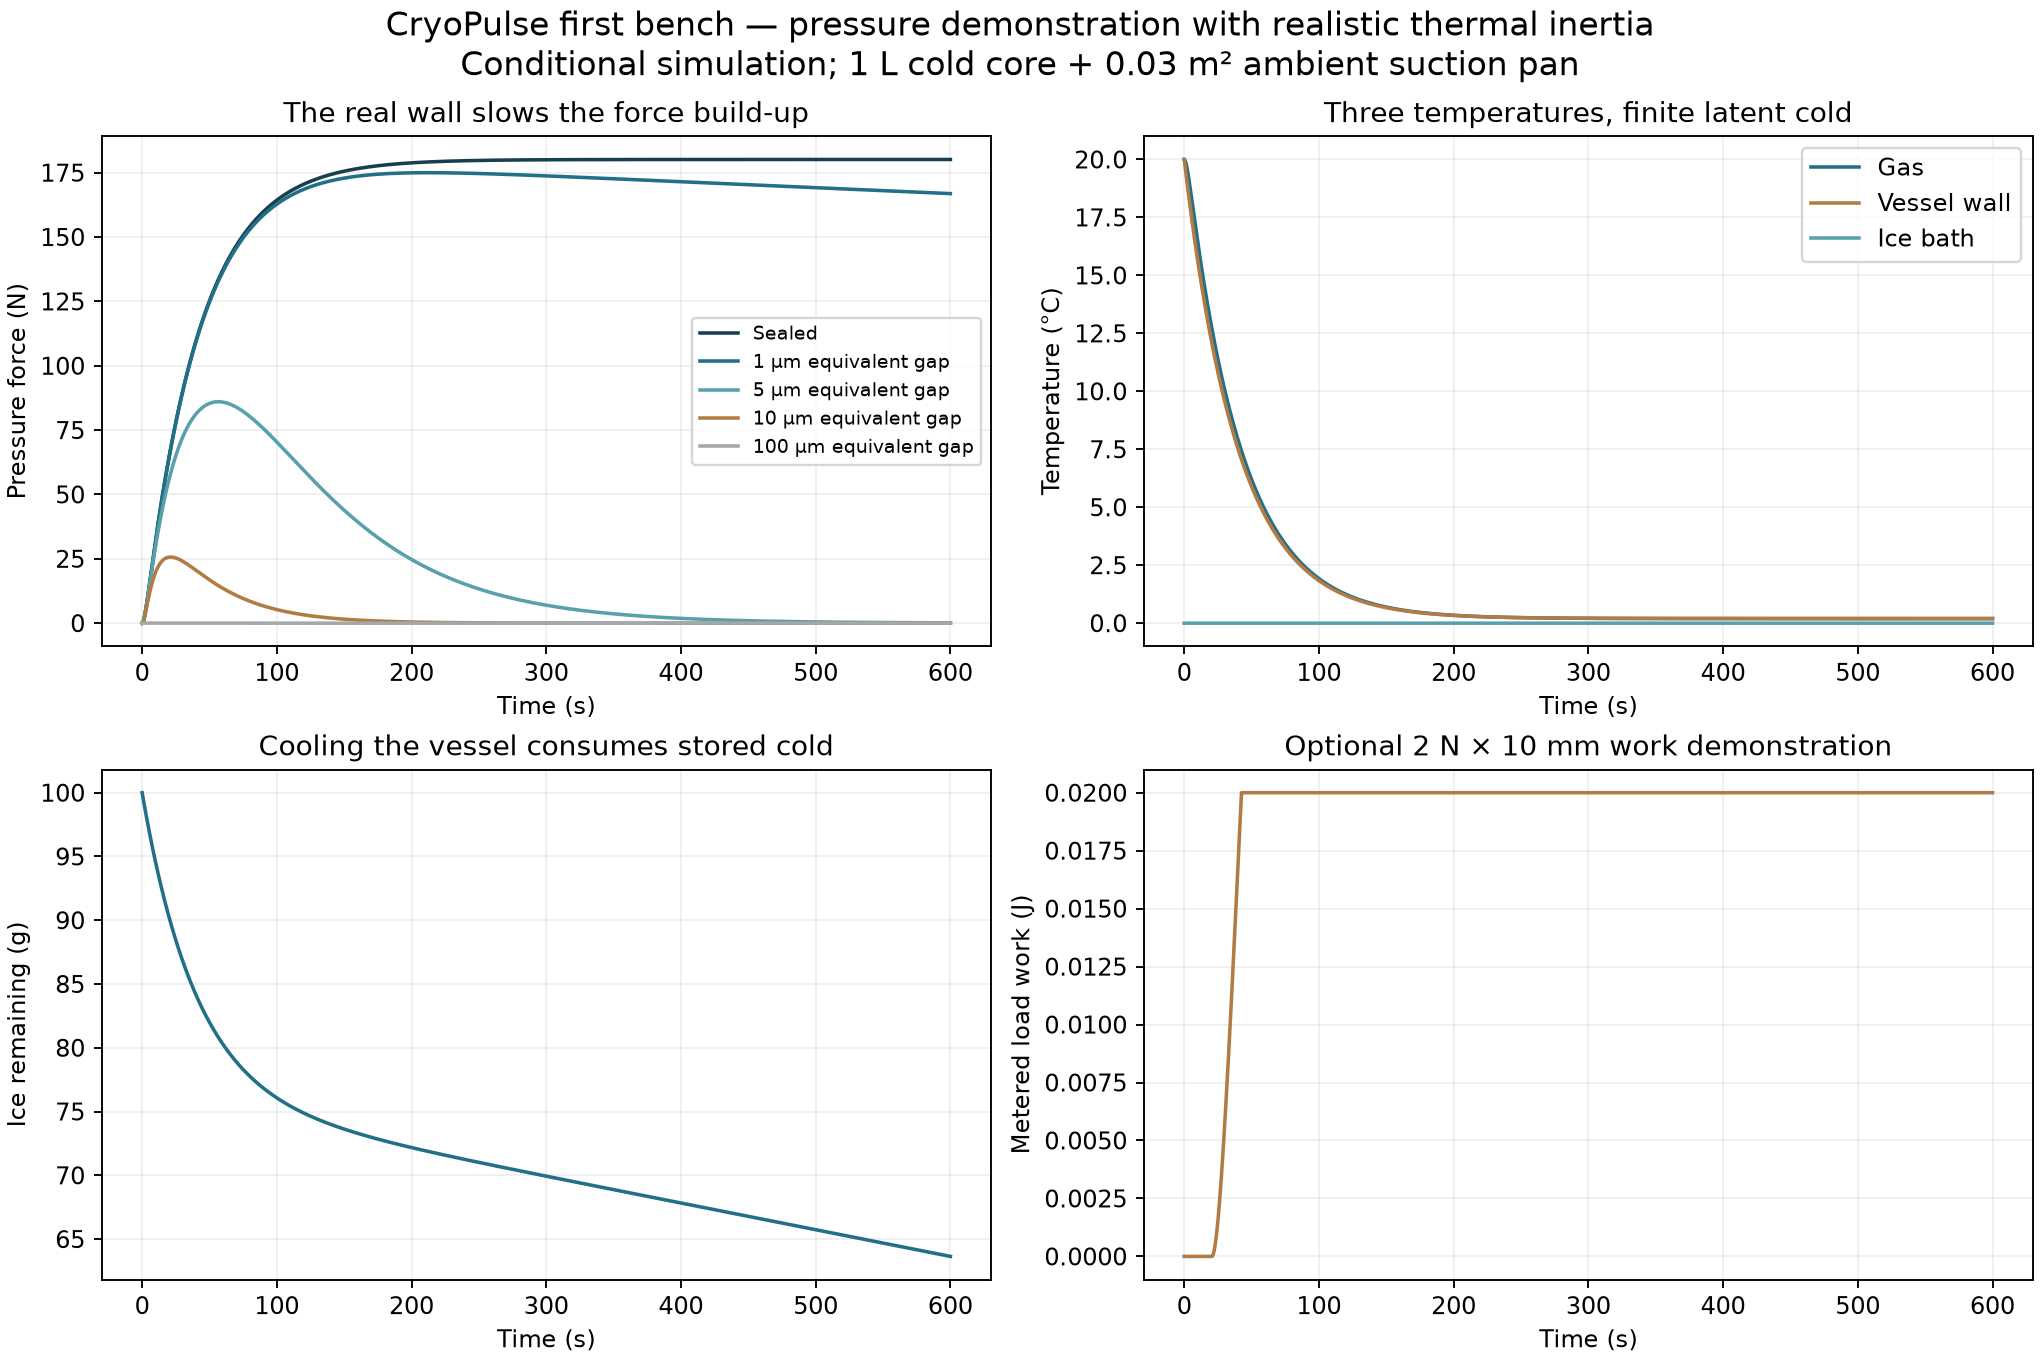
The direct cold-pressure model predicts 180.1 N of stationary pressure force after 600 s for a sealed 0.03 m2 pan, a 1 L cold core and the stated finite ice-bath/wall inputs. This is a prediction to test, not a measured holding rating.
The vehicle force-envelope model projects 22.67 m from 100 km/h under its assumed rolling-suction map, against a reference calibrated to 28 m. That result depends on unmeasured maps and ideal control knowledge.
Completed work: actual transient finite-volume CFD, coupled thermodynamic models, 84 vehicle cases, geometry/kinematic checks, STEP/GLB layout solids, image-generated concepts, finite-resource calculations and an experiment specification. Physical measurements: zero.
02What the original pressure intuition means in physics
Cooling a gas can reduce its pressure. Surrounding air then exerts a larger force on the outside of a connected suction footprint. That is a physically meaningful route from the original "empty region pulls back" idea to a measurable mechanism.
A pressure deficit is a gradient, not a new energy source. The absolute gas pressure remains positive. Negative gauge pressure and a negative reference free energy do not imply an unlimited energy supply.
For cold gas volume Vc at Tg and ambient dead volume Va at Ta, shared pressure is p = m R / (Vc/Tg + Va/Ta). Installed pressure-force reference is F = (pa - p) Aeff. Real seal preload, hose forces and leaks require calibration.
The static model tracks gas temperature, gas inventory, vessel-wall temperature and finite ice-bath enthalpy. Incoming gas brings enthalpy; wall cooling and bath warming consume cold availability. The optional bellows tracks work and resistance separately.
For the static reference, energy and entropy balances close numerically. A large stationary normal force is compatible with a small amount of available displacement work, because an unmoving force performs no mechanical work.
03First bench: three temperatures and a finite cold store
The fast chamber model and the first static proof are different experiments. The original low-active-mass cycle remains in thermoflow/. The slower static proof includes a 0.8 kg assumed vessel-wall mass at 500 J/kg/K plus 4 J/K inserts.
Nominal assumptions: 1 L cold gas; 150 mL total ambient dead volume; 0.03 m2 effective contact area; 0.8 m seal perimeter; 3 mm seal land; gas/wall conductance 0.45 W/K; wall/bath conductance 10 W/K; initial bath 0.1 kg ice and 0.2 kg liquid water at 0 C.
Those masses, volumes and conductances are design inputs. A real bath/jacket, supplier vessel and gas-line volume must be measured and substituted before comparing a built rig.
Nominal sealed prediction at 600 s: pressure deficit 6005 Pa, pressure force 180.1 N, bath heat absorbed 12127 J and ice melted 36.4 g. The gas and wall are near 0.20 C; the remaining ice holds the bath near 0 C.
The result is highly seal-dependent. A 5 micrometre equivalent gap has a transient force peak but almost no sustained force at ten minutes. A road surface cannot be assumed to provide the sealed-bench condition.
| Equivalent gap | Peak force (N) | Force at 600 s (N) |
|---|---|---|
| Sealed | 180.137 | 180.137 |
| 1 micrometres | 174.997 | 166.871 |
| 5 micrometres | 86.025 | 0.128 |
| 10 micrometres | 25.683 | 0.000 |
| 100 micrometres | 0.034 | 0.000 |
04Cold-to-suction response and leakage
05How to make the first demonstration scientific
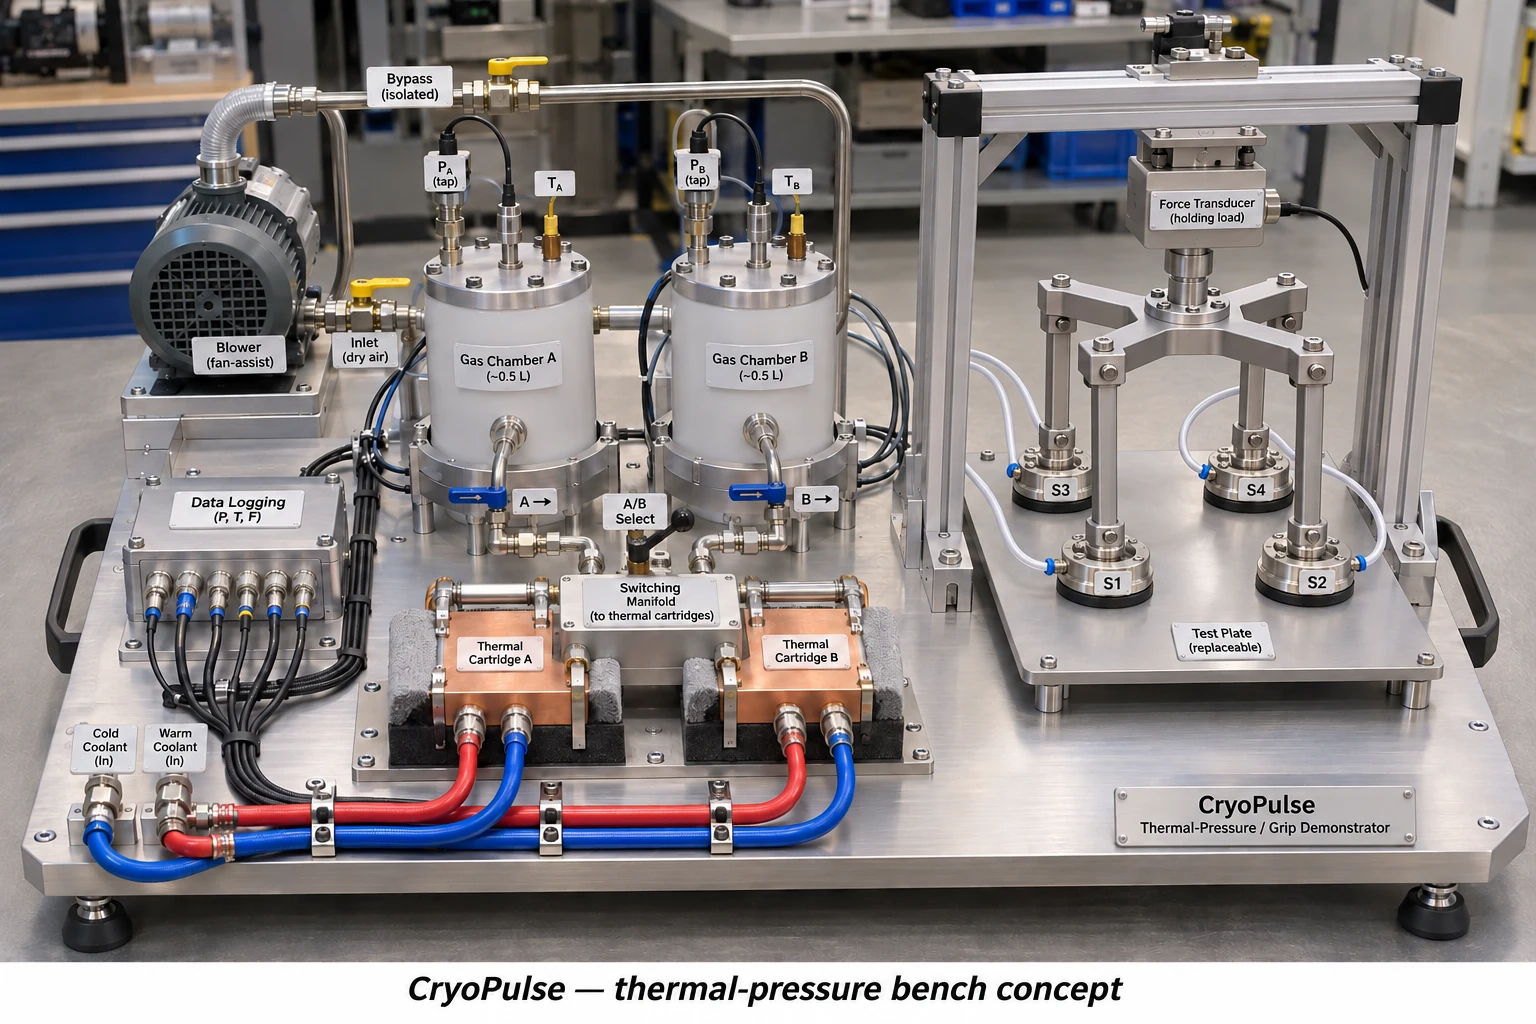
Two approximately 0.5 L commercial vessels rated for the intended external-pressure/vacuum and temperature range; weigh and measure their actual internal and thermal capacities.
Thermal interfaces connect the gas vessels to a finite 0 C ice/water cold store. Record actual ice/water mass, vessel temperatures and any circulation/heater electricity.
A separate ambient-temperature contact pan or four annular shoes connect by compliant gas hoses. Measure total hose, valve and pan dead volume.
A calibrated tensile load cell, rigid crosshead and metal links connect mechanically to the pan/shoe housings. The gas hoses do not serve as the force load path.
An independent stage and fixed ambient contact plate set normal displacement and seal preload. Record stage position and seal contact condition; pressure force and pull-off force are separate observations.
Optional calibrated bellows/piston connects to a low-force load and displacement encoder. Meter integral F dx; record spring/stiction and reset work.
06Predeclared controls and measurements
Does the cold treatment create a pressure deficit exceeding three combined standard uncertainties relative to paired null trials?
Does force versus pressure agree with the independently calibrated effective area after seal-preload/hose corrections, within the stated uncertainty?
Does any moving-load work exceed three combined standard uncertainties, with the complete energy/reset ledger reported?
Can mass and energy discrepancies be explained by measured leakage, heat leaks, thermal mass and instrument uncertainty without adding an unknown energy term?
| Channel | Specification target, not purchased equipment |
|---|---|
| Differential pressure | 0-10 kPa range; standard uncertainty <=20 Pa after calibration |
| Absolute/ambient pressure | Record both core and ambient pressure; absolute scale traceable |
| Force | 500 N tension/compression channel; standard uncertainty <=0.25 N after fixture calibration |
| Bellows work force | Separate low-range channel or calibrated deadweight; target uncertainty <=0.01 N around 2 N |
| Temperature | Gas at multiple positions, both vessel walls, bath and contact plate; target standard uncertainty <=0.1 K |
| Displacement/time | <=10 micrometre displacement uncertainty for the optional 10 mm stroke; synchronized logging >=10 Hz for this slow test |
| Cold and electrical energy | Weighed ice/water and bath calorimetry; meter every pump, heater, fan, controller and reset input |
07Experimental sequence
| Test | Purpose | Method |
|---|---|---|
| T0 | Fixture and sensor calibration | Calibrate pressure, load, displacement and temperature independently. Apply known pressure deficits with a separate calibration source and measure effective force area, seal preload and hose-force offsets. Isolate that source for cold-only trials. |
| T1 | Warm/null cycles | Begin with all gas volumes at ambient pressure and temperature. Run the valve/timing/fixture sequence with no temperature difference. Repeat with a vent open while applying the cold treatment to expose thermal drift or freezing-adhesion artefacts. |
| T2 | Sealed cooling mechanism | Reset to ambient, close the vent, apply the cold interface, and log pressure, temperatures and force for 600 s. Use at least five independent cold cycles interleaved in randomized order with five null cycles. |
| T3 | Leak and surface sensitivity | At stable gas temperature measure pressure relaxation separately. Repeat cold trials with characterized leak restrictions and defined dry/wet/rough contact coupons. Equivalent uniform gaps are a model parameter, not a measurement of a real seal. |
| T4 | Moving-load work | Use the calibrated low-force load module. Integrate measured force over measured stroke, subtract its independently measured spring/friction baseline, and meter the complete reset. Static holding force alone is not work. |
| T5 | Powered suction comparison | With the thermal circuit isolated, characterize a rated external blower and the same complete shoe/pan on a load cell. Record installed net force, pressure, flow and electrical power over seal gaps and surface coupons. |
| T6 | Unpowered wheel kinematics | Use a stationary supported rig, stopped wheels and a rated slow actuator. Verify support loads, docking clearance, pre-lift, continuous sweep, locks and sensor interlocks before adding any rotating impeller. |
| T7 | Later vehicle evidence | Only after measured fan, leakage, tyre/pad and actuator maps exist, replace the assumed maps and compare matched stopping and trajectory tests. No road demonstration is claimed by this package. |
08A small work output is a separate measurement
The optional bellows reference predicts 0.020 J of load work for a 2 N load over 10 mm. The model includes a finite stroke and resistance; it does not infer power from holding force.
Use a calibrated low-range force measurement or a weighed load and a displacement encoder. Record the actual bellows effective area, spring curve, stiction, line losses and full reset work.
Illustrative force uncertainty near 6 kPa: 20 Pa differential-pressure uncertainty, 1% effective-area uncertainty and 0.25 N force-channel uncertainty combine to about 1.91 N. This is an assumed instrument budget, not an experimental confidence interval.
The gas contact plate stays near ambient temperature. This separates cooling-induced gas pressure from freezing adhesion, condensation effects and temperature drift in the fixture or load cell.
Blank recording templates are supplied. No simulated values have been placed in the experimental data file.
09Spatial thermal CFD: what was actually solved
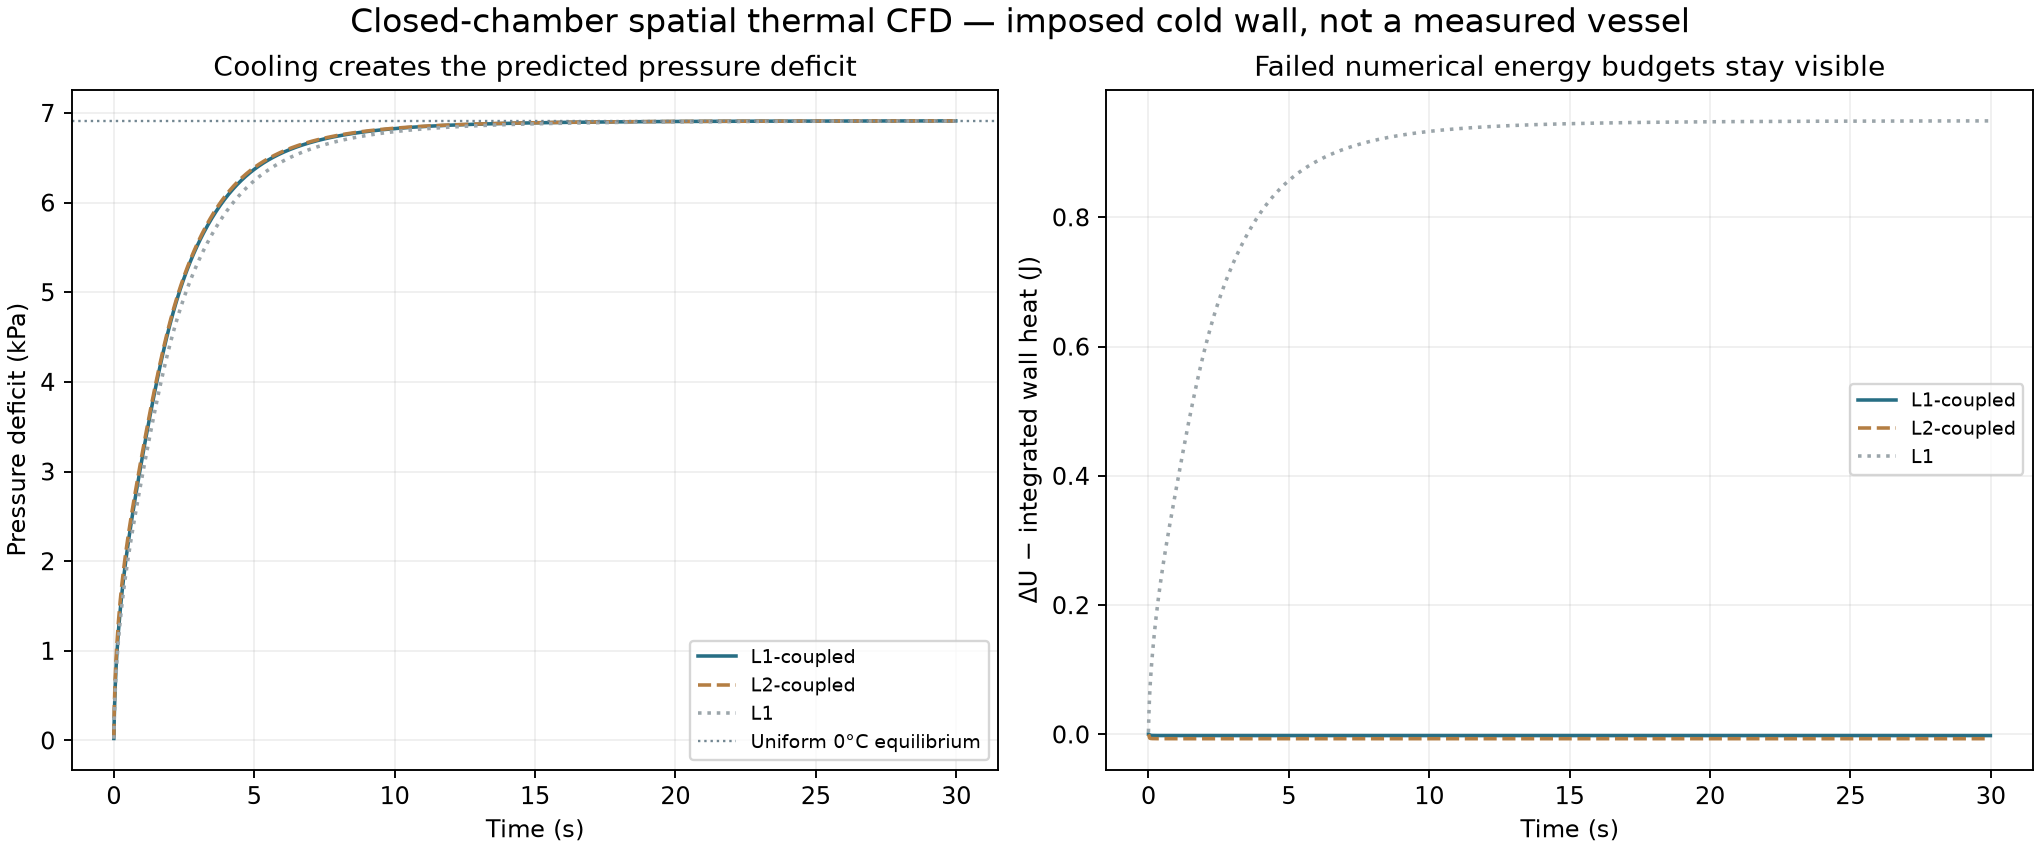
OpenFOAM v2412 buoyantPimpleFoam solved compressible perfect-gas, laminar buoyant flow in a closed horizontal cylinder of nominal 0.50 L, initially 293.15 K and 101325 Pa. All gas walls were set to 273.15 K. No mass-flow boundary or external pump was imposed.
The retained runs use six pressure/enthalpy outer correctors, no equation under-relaxation and a maximum 0.005 s step. Coarse and fine meshes contain 8,160 and 65,280 cells. The imposed wall has no physical thermal mass; the separate bench model accounts for wall and finite-bath costs.
Initial looser runs reached a plausible final pressure but missed the heat ledger by about 11%. They are retained as failed diagnostics. Both tighter 30 s runs pass the declared numerical mass/heat/entropy checks.
At 30 s the two retained mean pressures differ by -0.059 Pa. This is a two-mesh sensitivity, not a grid-convergence certificate or experimental validation.
The audit reads fields in double precision and uses the exact gas constant of the retained OpenFOAM runtime. A constant mismatch and a startup exception-trapping banner were corrected in the audit, without changing the solved fields.
| Run | Cells | Heat-ledger discrepancy | Final pressure (Pa) | Numerical budgets |
|---|---|---|---|---|
| L1-coupled | 8160 | 0.0209% | 94413.669 | Pass |
| L2-coupled | 65280 | 0.0769% | 94413.609 | Pass |
10The failed and retained heat budgets
11Resolved temperature fields
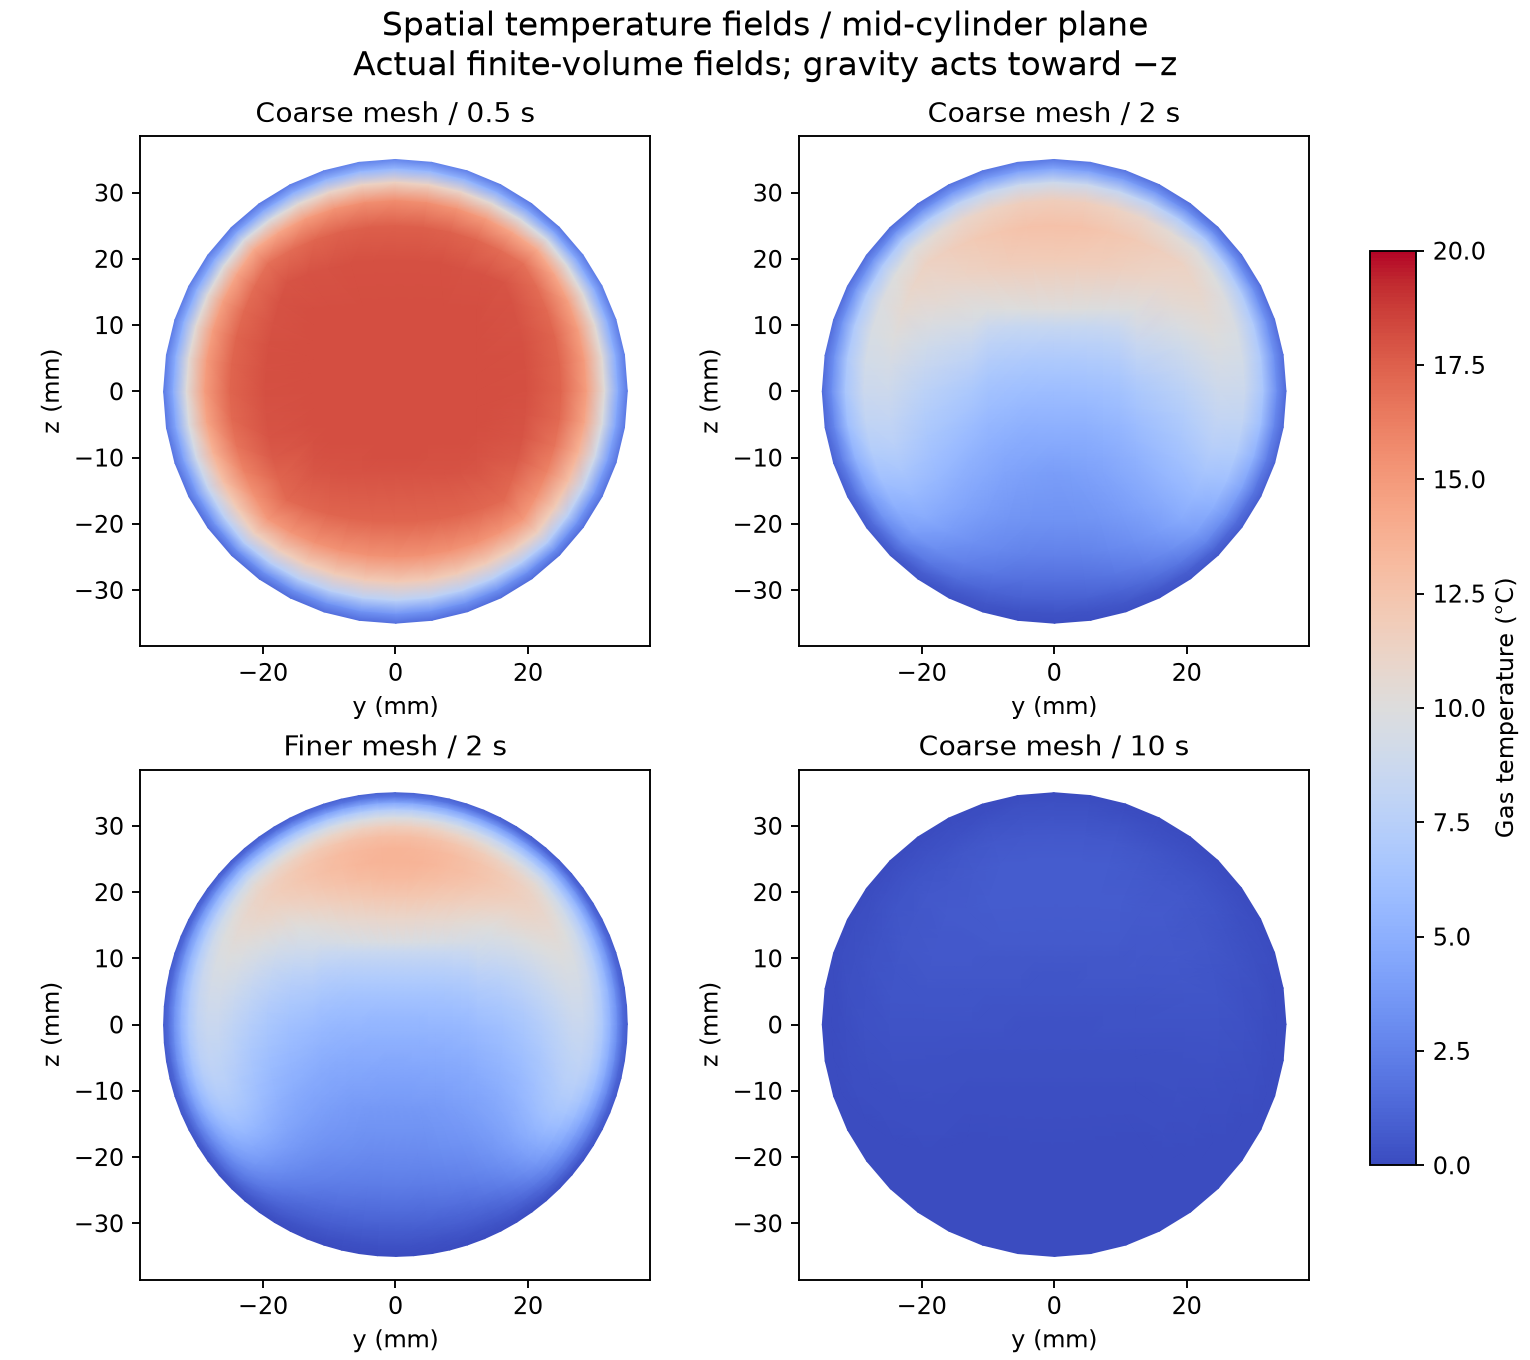
12Original thermal pulse engine remains a separate branch
The P2.1 timed two-chamber model, valve logic, thermal routing, regenerative ideal comparison and cycle sweeps remain in thermoflow/. They have not been replaced by the stationary suction proof.
For the retained moderate 0/40 C dry-air example, the specified two 0.5 L chambers predict milliwatt-scale gross expander output under the optimistic active thermal-mass inputs. The minimum cold reset is larger than that output in the stated case.
That does not imply every CryoPulse function is equally weak: direct suction uses pressure over area, while a thermal engine must produce flow and displacement work. The two tasks need different metrics.
A perfect-regeneration reference shows why extra gross work from a colder cold side cannot be treated as free: reversible cold restoration cancels that advantage in the stated ideal-cycle comparison. Real regeneration, valve losses and vessel heat capacity must be measured.
13Liquid nitrogen: reuse the cold along one honest state path
The revised N2 reference pumps saturated liquid from ambient pressure to 2 MPa, optionally provides upstream cold service, receives waste heat, expands, and then uses remaining downstream cold. Each kilogram follows one exclusive path.
CoolProp 8.0.0 supplies equilibrium nitrogen states. Pump and expander efficiencies are assumed 0.65, expander inlet 313.15 K, heater source 333.15 K and downstream 273.15 K service with a 5 K approach.
The 123 K upstream-service case is useful only if a real compatible load exists at that temperature. It is an option to explore, not a claimed vehicle requirement.
Full cooling-only capacity is never added again to an already expanded kilogram. N2 is not N2O or NO2; the latter substances receive no transferred phase/material result.
| Exclusive path | Net shaft (kJ/kg) | Hot heat (kJ/kg) | Cold-service heat (kJ/kg) | Useful cold exergy (kJ/kg) |
|---|---|---|---|---|
| shaft-first | 116.4 | 439.6 | 76.9 | 5.6 |
| 0C-service-before-and-after | 116.4 | 48.4 | 468.1 | 34.3 |
| graded-123K-and-273K-services | 116.4 | 233.4 | 283.0 | 290.2 |
14Temperature matching and the cryogenic resource ledger
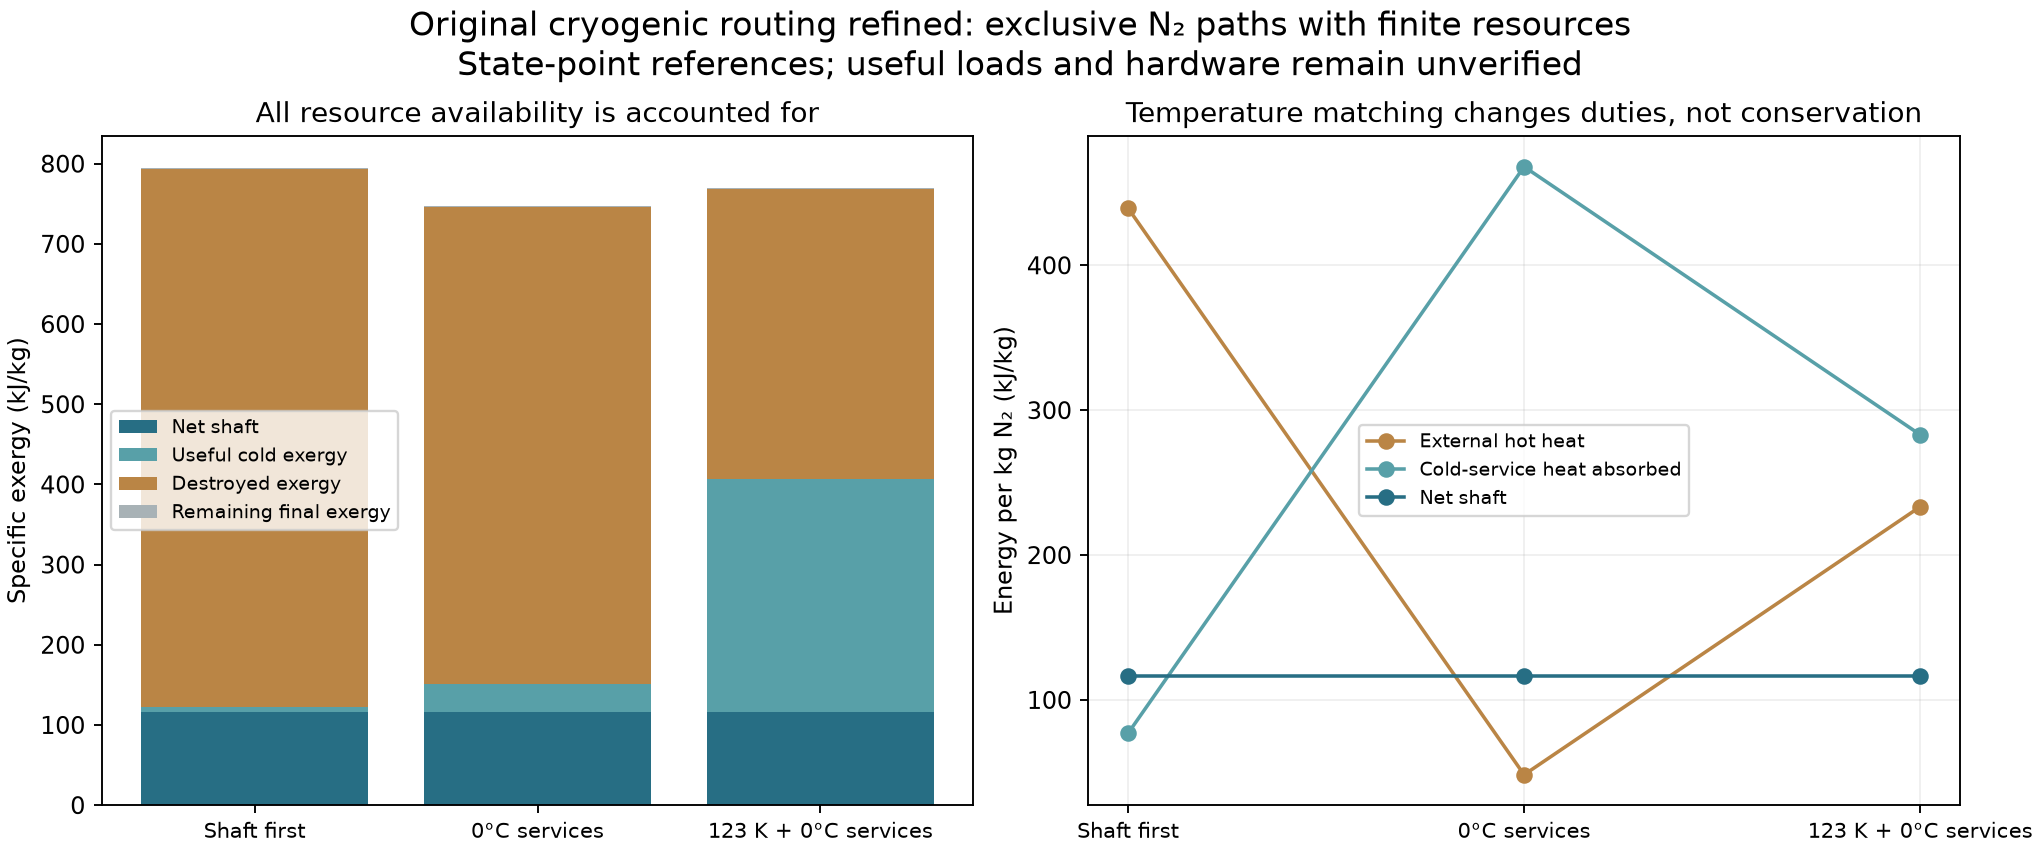
15Finite resource sizing: no continuous free supply
At the assumed efficiencies, supplying a 2047 W electrical fan from the 0 C pre/post-service path would require 0.0195 kg/s (70.4 kg/h) of liquid nitrogen. One kilogram lasts about 51.2 s under that steady duty.
That state path also requires about 945 W of external hot heat and 9147 W of compatible cold-service heat input. These services must actually be available; finite exchangers and phase stability have not been demonstrated.
The reversible pure-N2 liquefaction/reset lower bound at the same ambient reference is about 14494 W at that flow, before real production, separation, storage and auxiliary losses.
The rolling suction model currently uses a separate finite DC store. It is not powered for free by the cold-core calculation. A common resource controller must allocate real measured flows, heat duties and stored energy.
16Through-body airflow: retain shape as a design variable
The vehicle keeps the rounded body, broad paired elliptical intakes, twin through-passages and turbine bypasses from the original plan. The air path and outside shape are co-designed; conventional-car drag is not imposed on the proposed shape.
The existing P2 charge/powered actuator cases remain preliminary sensitivities. Added rotor reaction must be included with wall forces; fluid work and generator losses are separate from total propulsion power.
Overnight matched physical-time URANS runs compare the original P1 and P2 cold free-air bodies at 10 m/s on retained L4 meshes. Courant limits 0.5 and 0.25 provide a time-step sensitivity.
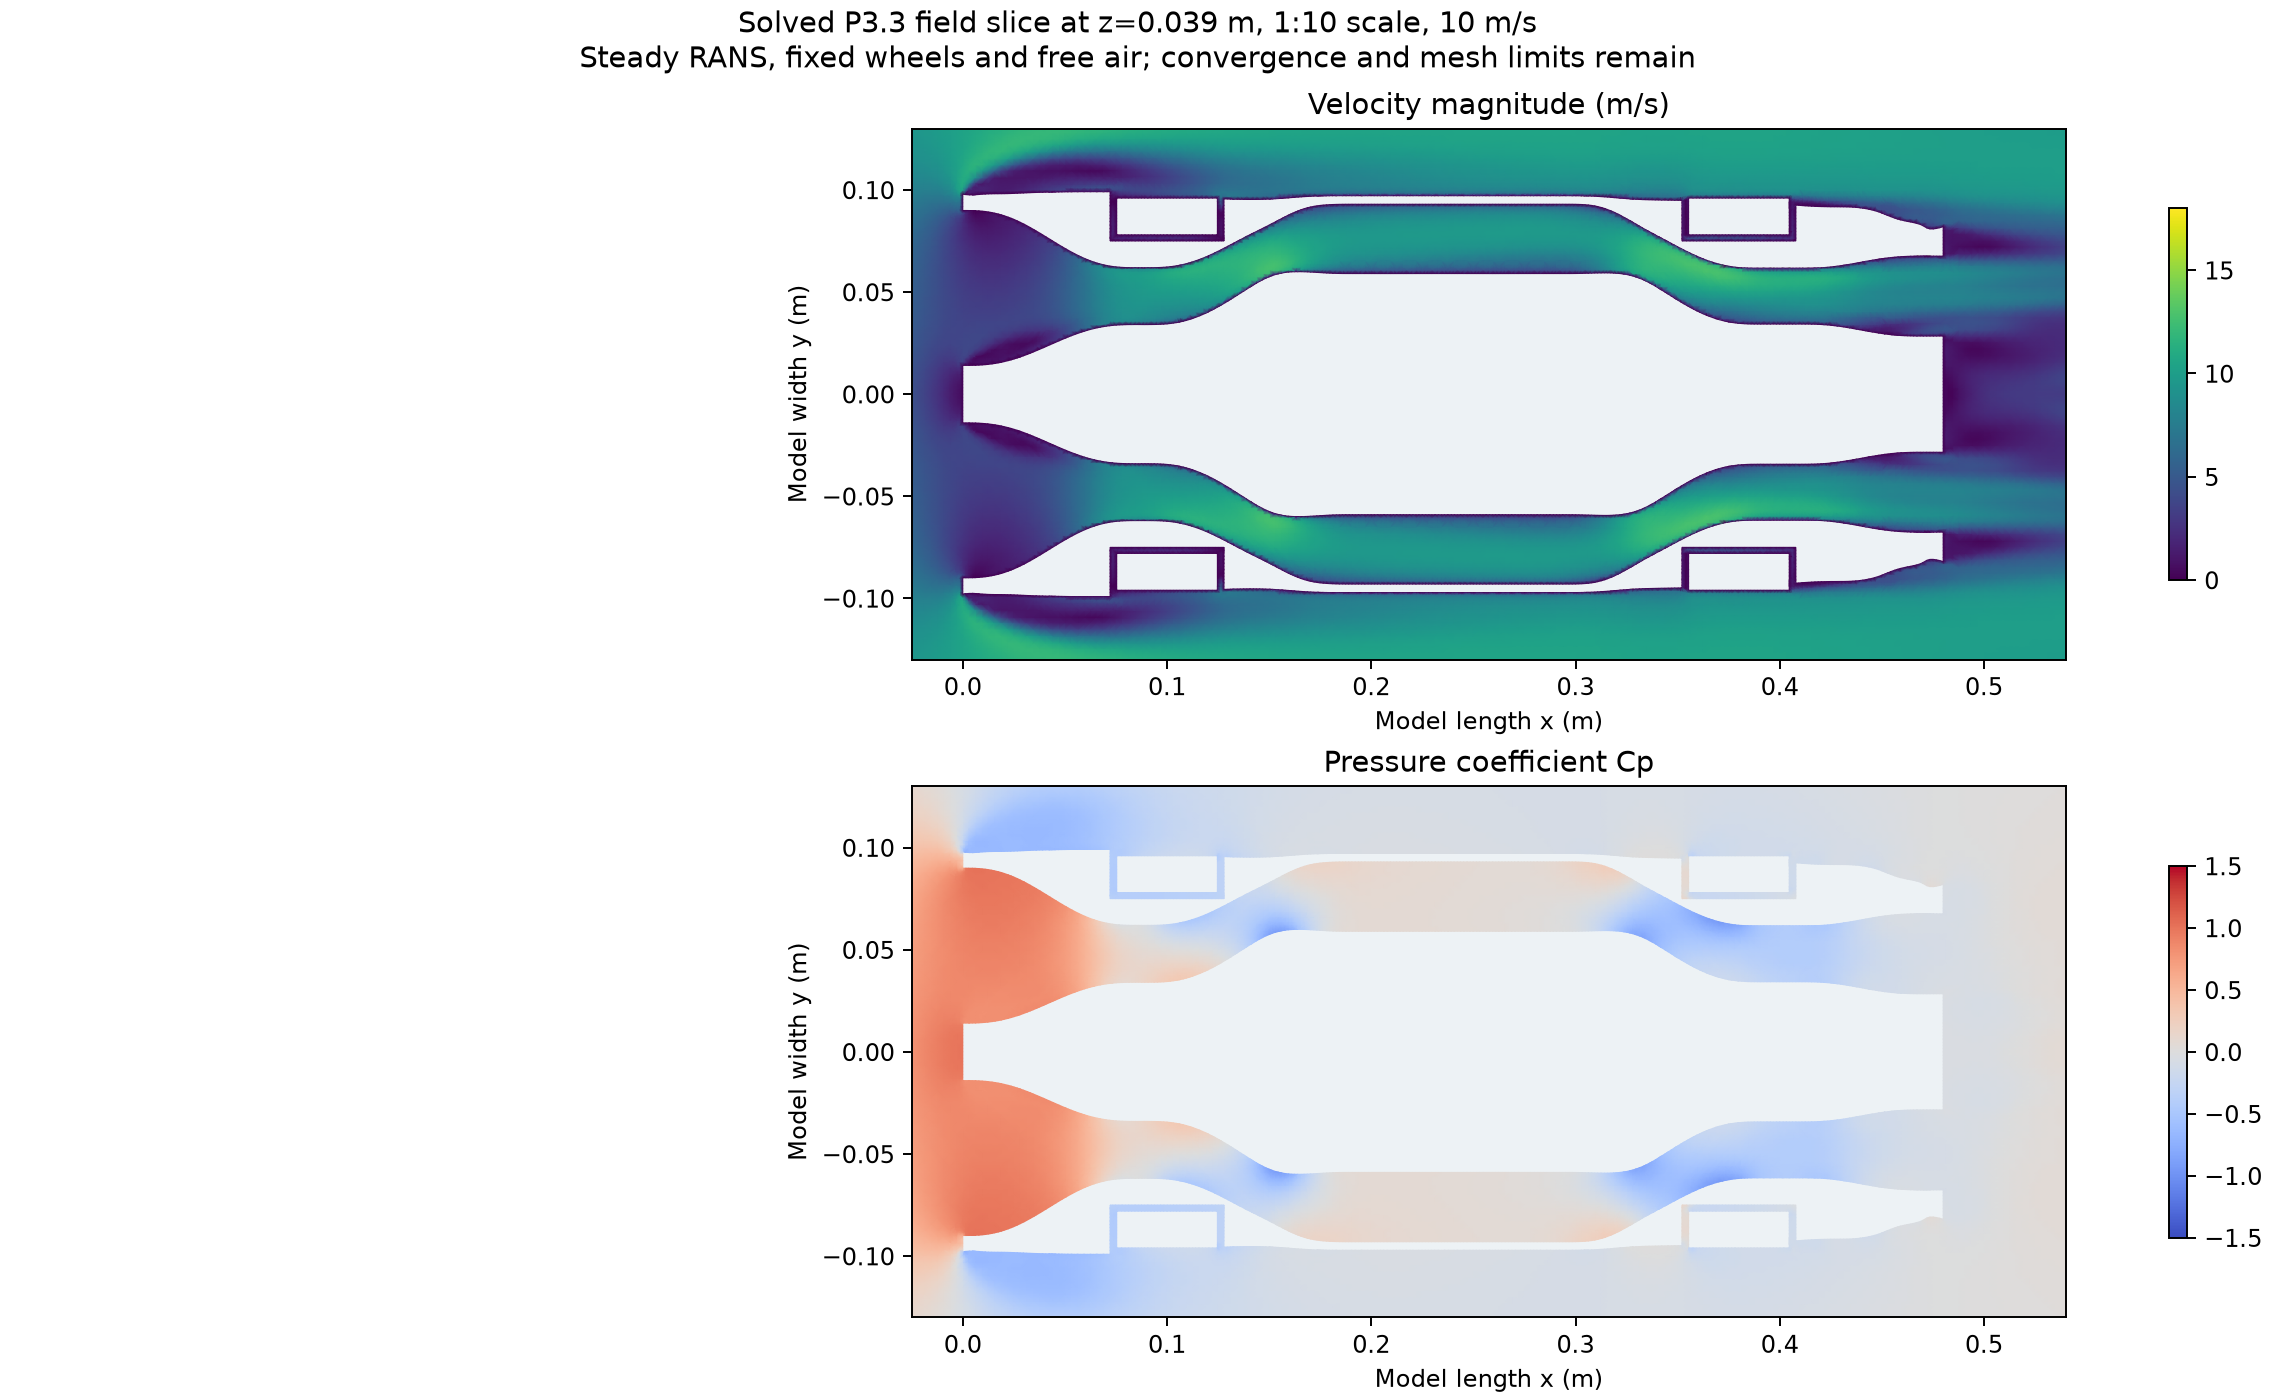
These calculations do not establish high-end full-scale road drag, cooling benefit or an integrated turbine map. Reynolds number, moving ground, wheel rotation, unresolved wall layers and extended concave-cell mesh failures remain.
| Maximum Courant | P1 mean drag (N) | P2 mean drag (N) | Conditional change |
|---|---|---|---|
| 0.5 | 0.71784 | 0.59992 | 16.43% lower |
| 0.25 | 0.71847 | 0.60052 | 16.42% lower |
17Matched transient airflow histories
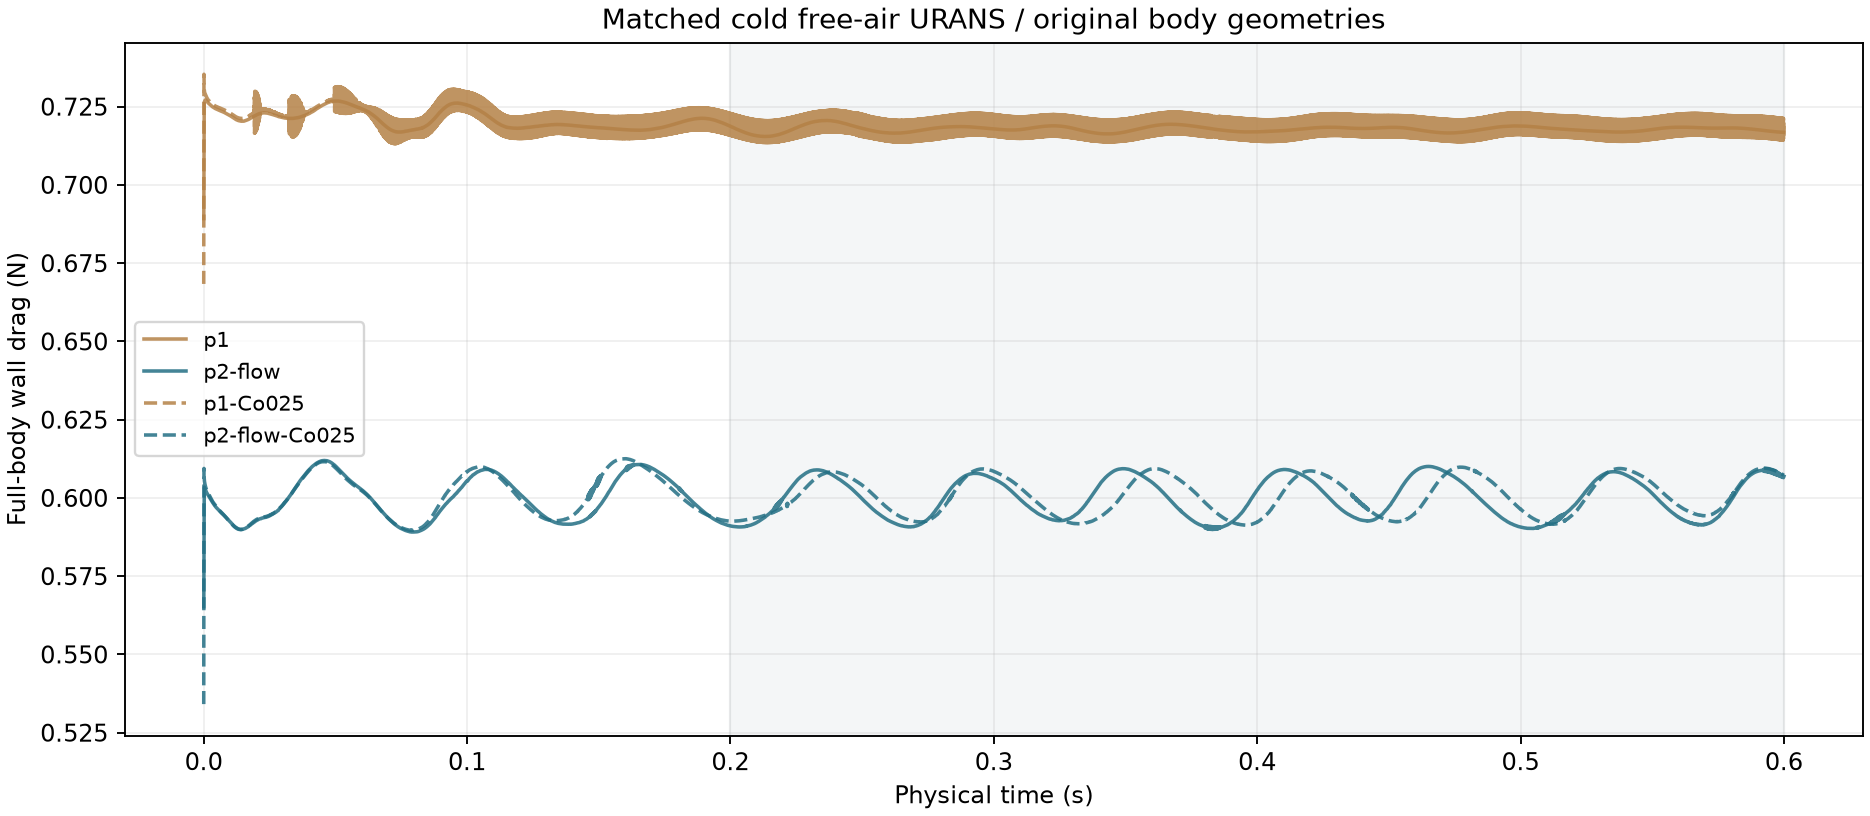
18Actual CAD: rolling tyre contact and underfloor pressure
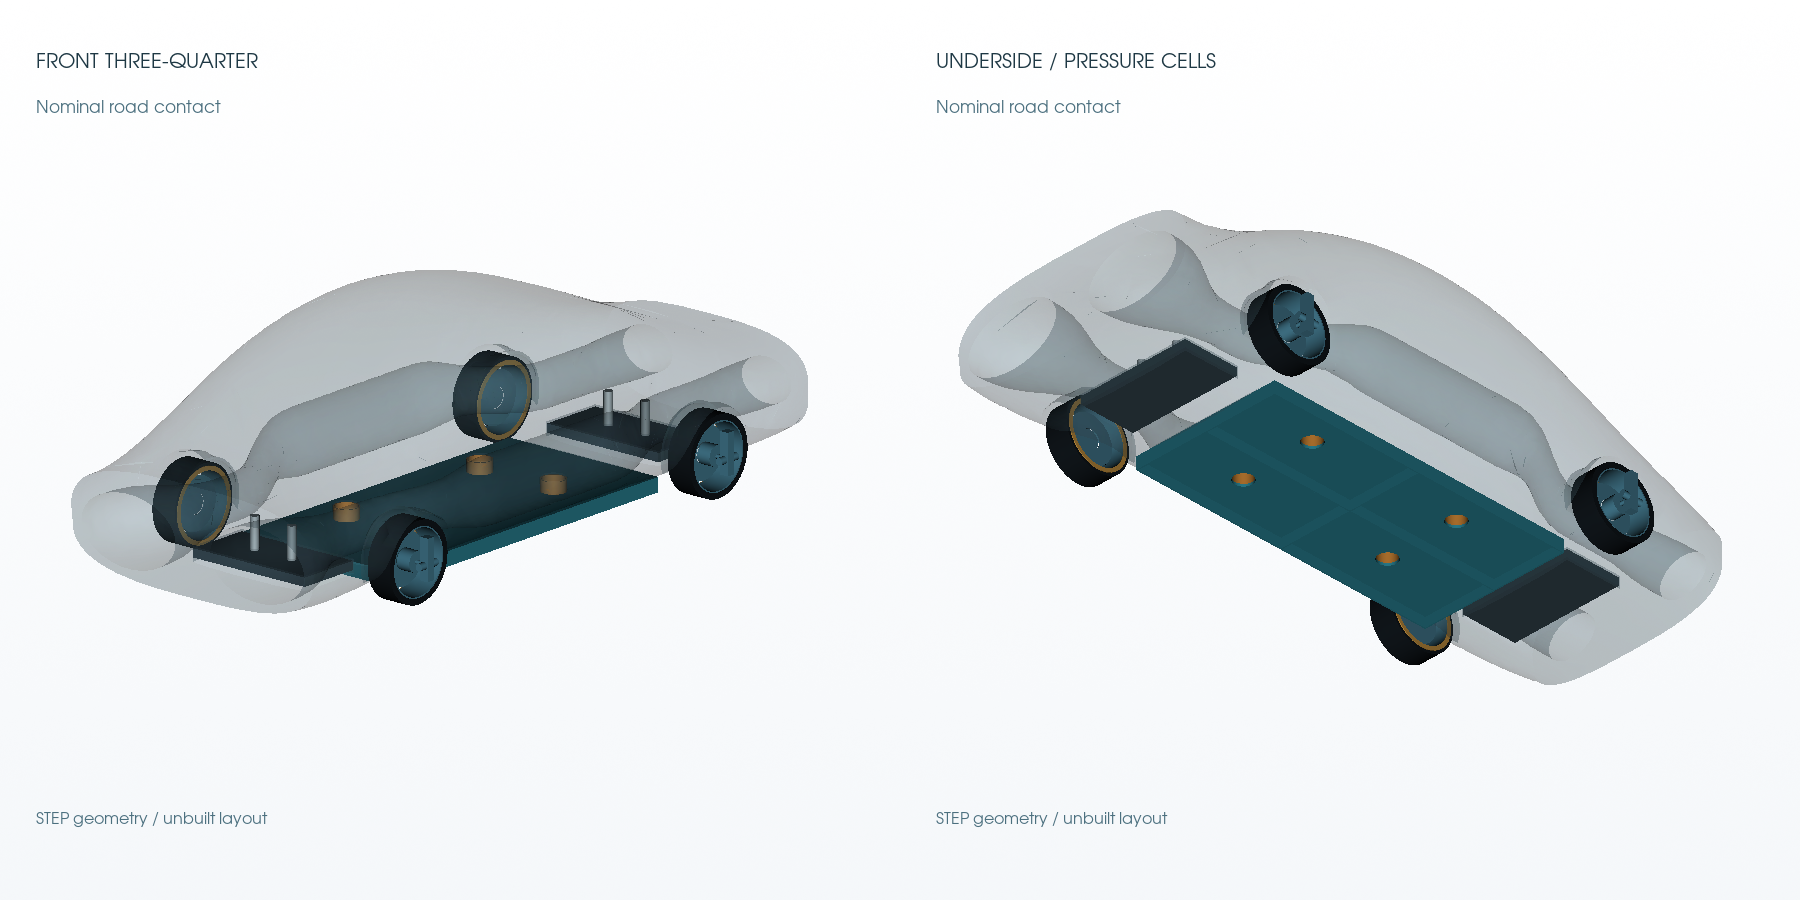
19Actual CAD: supported outward wheel-shoe pose
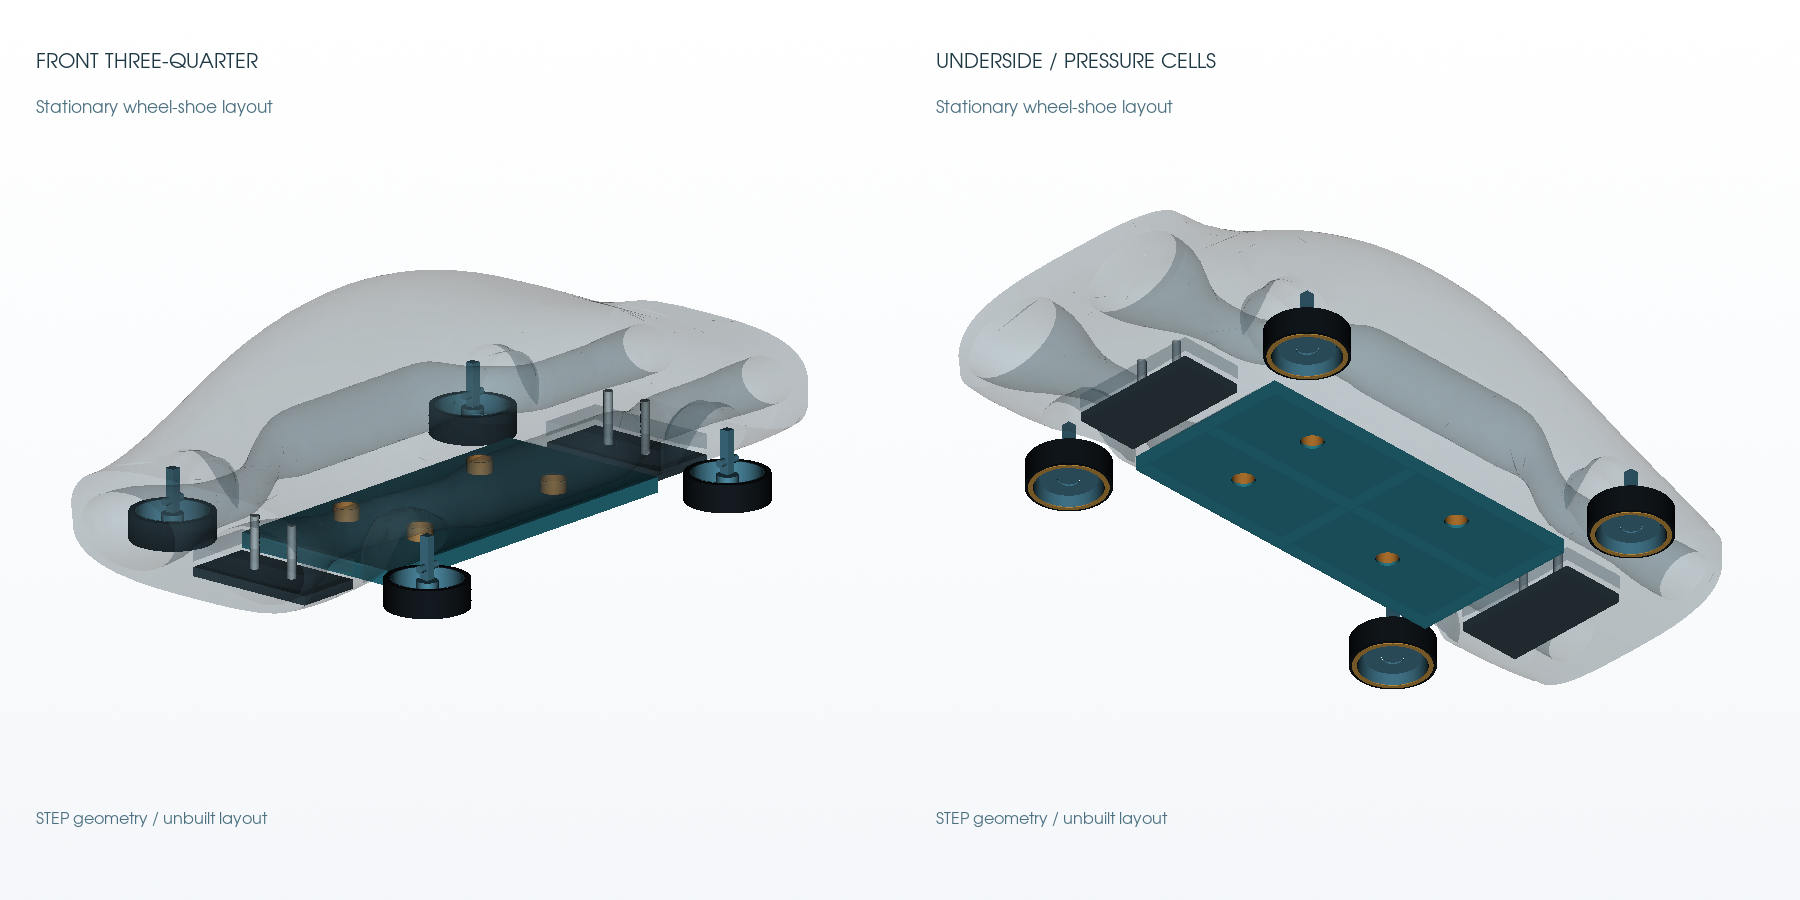
20Geometry and mechanism constraints are explicit
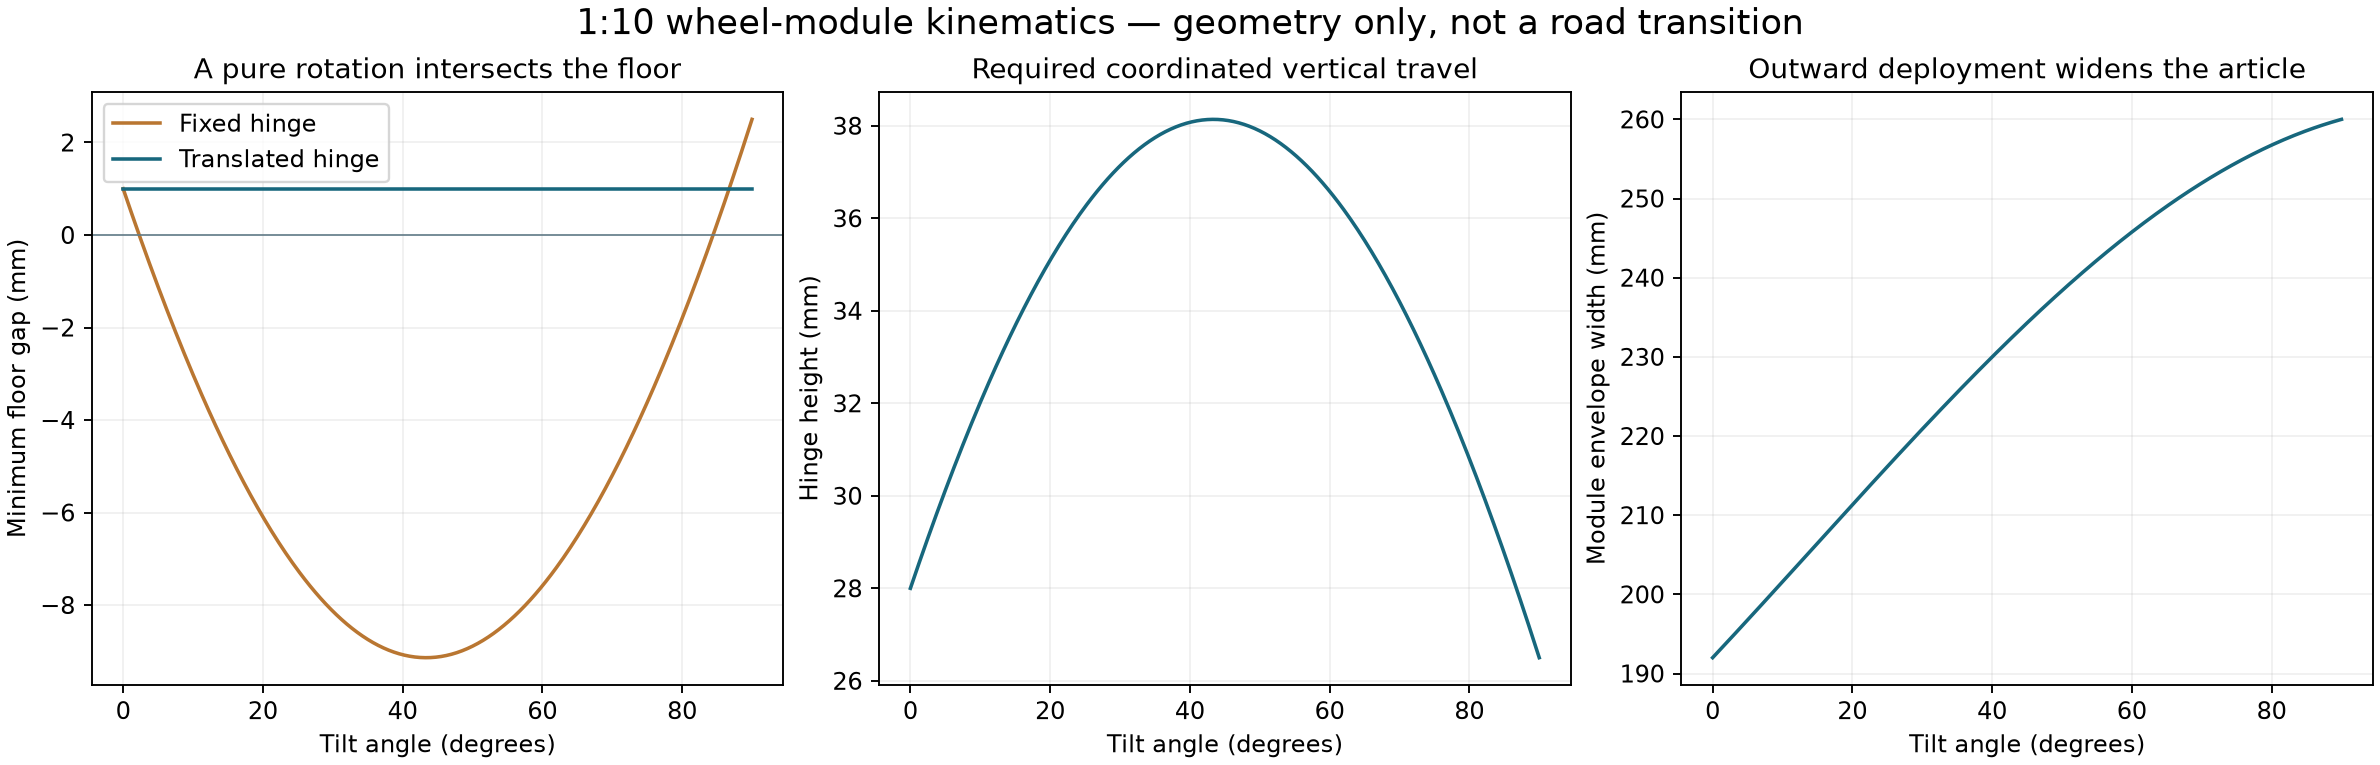
The original wheel-sweep body passed 47,952 surface-mesh enclosed-point tests, with zero sampled points inside the body. A separate exact Boolean check found zero intrusion into the protected nominal duct envelopes.
A pure fixed hinge intersects the ground. The proposed coordinated slider/tilt path needs at least about 12.54 mm of hinge travel at 1:10 before tolerance and bearing allowances. The road-contact export includes a separate 1 mm unloaded pre-lift before that clearance path.
The new tray has four internal cells of 123.5 x 58.5 mm, total effective area 0.028899 m2 and total seal perimeter 1.456 m. Those actual CAD values drive the latest vehicle pressure map.
Support pads are placed fore and aft of the pan, retract above the road clearance and extend at rest. The body is still a flow-exclusion/layout envelope, not a solid structural carbon body or a mass certificate.
STEP masters, coloured GLB view meshes, nominal road/deployed poses and standalone tray/ports are supplied. New body pockets have not inherited the original P2 CFD drag result.
21Wheel trajectory and clearance law
22Vehicle projections: benchmark, assumptions and fairness
The generic 1500 kg high-performance reference is calibrated to the manufacturer-published Koenigsegg One:1 stopping figure of 28 m from 100 km/h. This identifies one equivalent longitudinal parameter; it does not recreate Koenigsegg tyres, geometry, ESC or aerodynamic balance.
The prototype adds an assumed 170 kg hardware target, matched aerodynamic drag, a finite 100 kJ fan store and pressure force from an assumed 3 kPa stall / 1 m3/s full-size total fan map. Actual fan pressure/flow, area, leakage and tyre/pad maps remain unmeasured.
The model solves planar longitudinal/lateral/yaw motion with steering response, friction-circle limits, approximate load sensitivity, quasistatic normal transfer and a common ideal yaw-priority brake allocator. Both reference and prototype are granted exact grip/state knowledge.
There is no wheel-spin ABS state, suspension roll/pitch dynamics, sensor error, friction estimation delay or road-certified deployment mechanism. Treat these as conditional force-envelope projections, not achieved stopping distances.
84 cases cover 100 and 120 km/h, uniform high/low grip, split grip, a curve, a low-grip patch, crosswind and a pressure-channel failure. Surface factors are hypothetical multipliers rather than measured weather coefficients.
23100 km/h conditional comparison: preserve steering
| Scenario | Mode | Path (m) | Max path error (m) | N2 used (kg) | Example stability limits |
|---|---|---|---|---|---|
| uniform-high | reference | 28.00 | 0.00 | 0.00 | Pass |
| uniform-high | body-suction | 22.67 | 0.00 | 0.00 | Pass |
| uniform-high | body-suction+gas | 22.67 | 0.00 | 0.00 | Pass |
| uniform-low | reference | 197.00 | 0.20 | 0.00 | Pass |
| uniform-low | body-suction | 153.59 | 0.19 | 0.00 | Pass |
| uniform-low | body-suction+gas | 144.15 | 0.18 | 2.50 | Pass |
| split-grip | reference | 133.47 | 0.00 | 0.00 | Pass |
| split-grip | body-suction | 104.57 | 0.00 | 0.00 | Pass |
| split-grip | body-suction+gas | 97.59 | 0.00 | 2.50 | Pass |
| curve | reference | 49.80 | 0.10 | 0.00 | Pass |
| curve | body-suction | 39.09 | 0.07 | 0.00 | Pass |
| curve | body-suction+gas | 38.32 | 0.07 | 2.00 | Pass |
| low-patch | reference | 53.02 | 0.00 | 0.00 | Pass |
| low-patch | body-suction | 47.80 | 0.00 | 0.00 | Pass |
| low-patch | body-suction+gas | 47.80 | 0.00 | 0.00 | Pass |
| crosswind | reference | 47.03 | 0.03 | 0.00 | Pass |
| crosswind | body-suction | 37.18 | 0.02 | 0.00 | Pass |
| crosswind | body-suction+gas | 36.66 | 0.02 | 0.79 | Pass |
| one-shoe-pressure-loss | reference | 46.07 | 0.00 | 0.00 | Pass |
| one-shoe-pressure-loss | body-suction | 37.53 | 0.00 | 0.00 | Pass |
| one-shoe-pressure-loss | body-suction+gas | 37.28 | 0.00 | 0.63 | Pass |
24Trajectory comparisons and failure cases
25Unknown materials and timing can reverse a gain
26What failed, and what the revised architecture does
17 forced wheel-shoe cases fail the example stability limits. Some show shorter path distance while developing very large sideslip or spin. Counting them as improved braking would be misleading.
The revised rolling mode keeps the tyres steering while the same fan source draws from a four-cell underfloor plenum. Only at rest does the proposed supported sequence undock and turn the wheels out into local suction shoes.
Proposed sequence: verify low speed and stable support; lower/load-check pads; stop fans; isolate pressure lines; retract docking adaptors; pre-lift; tilt and lock; select local cavities; ramp fan pressure. Reverse and verify the road locks before moving.
A stale or low-confidence road estimate should trigger a controlled stop using measured motion and a selected feasible travel corridor. Straightening is a trajectory/control objective, not a guarantee that an unseen curved road remains underneath the vehicle.
Continuous road-wheel tilting remains an original research branch and is retained in the stress tests. The stationary sequence is the next mechanism test because it avoids removing steering during the most demanding brake phase.
27Hydraulics, gyro loads and the structural scale problem
Magnetically driven hydraulics means an electrical motor or solenoid drives pressure in an independent hydraulic circuit. Permanent magnets do not supply continuing cycle work. Source, pump efficiency, leaks and actuator work must be recorded.
At 100 km/h a representative 25 kg road-wheel assembly of radius 0.27 m and inertia 0.91 kg m2 has angular momentum near 94 N m s. A 1.5 rad/s tilt can impose roughly 141 N m of gyroscopic constraint torque per wheel. These are illustrative inertia/rate inputs, not a bearing specification.
Mirrored outward tilts can cancel final vertical road-wheel momentum while transferring the original common pitch-axis momentum to the chassis/supports. Gyroscopic torque is perpendicular to ideal tilt motion, so peak torque multiplied by tilt angle is not automatically drive work.
Do not blindly scale the bench tray thickness tenfold. Conversely, a full-size unstiffened thin roof can deflect enough to destroy the seal. For a simply supported one-way 2 mm aluminium strip at 3 kPa, a 0.585 m span gives a linear deflection estimate near 0.10 m, outside small-deflection validity; support spacing near 0.1 m reduces that estimate below 0.1 mm.
These mechanics screens identify loads and supports to measure/design. They do not qualify a pressure roof, wheel rotor, hydraulic mechanism or crash structure.
28Packaging and resource assumptions that still need to close
The yaw-jet reference starts with 3 kg of precharged gaseous N2 at 2 MPa and 313.15 K. Its ideal-gas tank volume is about 139.4 L. Vessel mass, certified hardware, pipework and this volume must fit a real manufacturer package.
Adiabatic blowdown, converging-nozzle mass flow/pressure thrust and a 0.5 kg reserve are included. The soft-closing valve model prevents using more than the allowed 2.5 kg. The gas store is not an unlimited yaw actuator.
The N2 state-path expander that exhausts near ambient pressure cannot simultaneously feed the 20 bar jet source. Either use separate storage, allocate an upstream branch or redesign the pressure path and count the lost shaft/cold service.
The 170 kg installed mass and the full-size fan map remain targets. No full vehicle bill of materials, range benefit or all-mode optimum is established by this package.
29Original freezing-water idea: calculate the complete cycle
The original expansion-of-freezing-water proposal is retained as WP9. An equilibrium piston reference follows liquid and ice Ih along the melting curve, freezes at high pressure and melts at low pressure. The enclosed pressure-volume area gives complete cycle work.
At 20 MPa high pressure and ambient low pressure, the calculated freezing temperature is 271.612 K. The high-pressure freezing leg gives 1953 J/kg; the complete ideal cycle gives 1875 J/kg, or 0.521 Wh/kg of water only.
The hot/cold duties are about 337.6/335.7 kJ/kg. Cycle efficiency 0.555% remains below the two-reservoir Carnot limit 0.564%. Minimum cold restoration to 20 C is about 26.6 kJ/kg.
The IAPWS melting-line verification point is reproduced and the water/ice property packages are recorded. No cycle rate, nucleation control, pressure-vessel design, ice-jamming solution or practical pressure store has been demonstrated.
30Freezing-pressure cycle and reset
31Original magnetic collision mitigation: a cooperative test
WP10 is retained as a cooperative magnetic-force study. The model uses opposing currents in two coaxial air-core circular coils. Exact mutual-inductance and independent Neumann-integral/force-gradient calculations are cross-checked.
For the illustrative radius 0.25 m, 100-turn, 100 A coils, the fixed-current approach work from 10 m to 0.1 m is 33.77 J. One 1500 kg vehicle at 100 km/h has about 578.7 kJ of kinetic energy.
Raising current changes force quadratically but also changes electrical loss, field energy, driver exchange and mechanical stress. At fixed current, the force integral is not automatically the decrease of field energy; both current regulators exchange energy as mutual flux changes.
A small cooperative bench reference, radius 40 mm, 100 turns and 5 A, predicts 0.517 N at 20 mm separation. Use rated current-limited coils and independent force/distance metrology; this is not a vehicle protection rating.
An arbitrary unmodified obstacle is not assumed to provide repulsion. Alignment, vehicle steel, finite winding size, current dynamics and practical mounting remain unresolved.
32Magnetic force falls with separation
33Premium materials are specified by function
Use new unused traceable stock, manufacturer/lot documentation, inspected machined sealing faces and documented composite storage/cure records. No salvaged parts or purchases are implied.
Grip is a measured interface property depending on surface, water/ice, temperature, speed, pressure, wear and compound. Expensive base material alone is not assigned a friction improvement.
The moderate-temperature proof keeps cold vessels separate from the ambient contact plate. A later true-cryogenic module needs its own supplier-rated materials, seals and phase/thermal design.
| Function | Candidate specification / qualification |
|---|---|
| Rated gas vessels/fittings | New traceable 316L stainless commercial vacuum-compatible components; supplier temperature and external-pressure rating govern |
| Thermal inserts | New oxygen-free copper interfaces with documented mass and thermal contact; mechanically removable from the gas envelope |
| Pan/tray and brackets | New traceable 6061-T6/T651 or functionally equivalent machinable aluminium, with inspection of the actual sealing face |
| Thermal breaks | PEEK or G10 candidates in moderate-temperature mounts; grade and creep/contact load verified before purchase |
| Replaceable seals/contact coupons | Fresh documented elastomer grades selected for the measured surface, water, temperature and wear conditions. Price is not assigned a friction gain. |
| Later cryogenic loop | Separate supplier-qualified cryogenic seals, pressure equipment and compatible materials. Moderate-temperature elastomers receive no assumed liquid-N2 qualification. |
34All twelve original work packages: 1-6
| ID | Original work package | What this revision supplies / what remains |
|---|---|---|
| WP1 | Body and duct co-design | P1/P2 cold body CFD and through-passage CAD; new full integration still requires moving-ground/rotor/thermal tests. |
| WP2 | AirDrive and heat-assisted flow | Timed thermal chamber model, real-N2 references and new spatial cooling CFD; no measured turbine/exchanger map. |
| WP3 | GTBS aerodynamic braking | Pressure/leakage fan-shoe maps, underfloor tray and wheel-shoe layout; assumed fan inputs require installed force tests. |
| WP4 | Road and trajectory aware braking | 84 planar scenarios and stability filtering; real ABS, grip estimation, sensors and full vehicle dynamics remain. |
| WP5 | DDTC and pulse stores | Original pulse/store branch retained; shared duty allocation and finite-source interfaces need hardware maps. |
| WP6 | Suspension and contact surfaces | Slider/tilt law, sampled clearance tests, nominal road contact and supported pose; bearings/locks/loads need qualification. |
35All twelve original work packages: 7-12
| ID | Original work package | What this revision supplies / what remains |
|---|---|---|
| WP7 | Heat recovery and electrical storage | Finite electrical/gas stores and heat/exergy accounting; production/reset losses remain separate. |
| WP8 | Cryogenic thermal routing | Exclusive graded N2 state paths; N2O chemistry/materials remain a separate unresolved option. |
| WP9 | Freezing-water pressure store | IAPWS water/ice equilibrium pressure-volume cycle and Carnot/reset checks; no practical high-pressure phase actuator. |
| WP10 | ECRS electromagnetic mitigation | Cooperative-coil force/range/driver-energy screen and small bench target; no general anti-collision guarantee. |
| WP11 | Joint optimization and fault arbitration | Proposed mode/resource sequence and failure gates; a measured-map supervisor remains to be implemented. |
| WP12 | Manufacturer package and research paper | This manufacturer/research review package and a focused paper route; no submission or peer-reviewed result. |
36Claims that the evidence can and cannot carry
Supported within the stated models: cooling a finite gas inventory lowers pressure; pressure over a sealed area can create a useful static force; leakage and wall thermal mass materially limit the response; finite cold availability is consumed.
Conditional engineering projections: rolling underfloor suction can add normal load and reduce the stopping path under the assumed installed fan/leak/tyre inputs. Shape co-design changes calculated cold-flow drag in the retained body models.
Not demonstrated: a built CryoPulse prototype, measured net energy gain, self-replenishing cold, real high-end-car superiority, safe high-speed wheel deployment or universal magnetic collision avoidance.
Next decisive evidence: calibrated cold-only pressure/force trials, a moving-load work measurement with reset costs, installed fan/seal maps and stationary actuator/clearance tests. Then replace the assumed maps and repeat vehicle comparisons.
The practical research contribution should be framed as a testable thermal-pressure/ground-grip architecture with resource allocation, rather than a claim that an energy void creates new energy.
37A focused scientific paper route
Working title: Cooling-induced pressure deficits for distributed suction: coupled thermal-mass, leakage and vehicle force-envelope references.
Possible abstract: We formulate a finite-reservoir thermopneumatic suction architecture and examine its energy, entropy and leakage limits. A lumped gas/wall/ice-bath model is compared with closed-chamber compressible finite-volume cooling calculations. Static holding and finite displacement work are distinguished. A manufacturer-oriented vehicle study uses assumed installed pressure maps and a benchmark-equivalent planar model, explicitly excluding spin-driven stopping reductions. The work provides reproducible numerical references and a predeclared experimental design; no physical performance is claimed.
Before submission: establish the specific original contribution against thermopneumatic pumps, suction vehicles, cryogenic exergy systems and existing suction/freezing grippers; complete the numerical sensitivity discussion; add physical evidence if claiming demonstrated hardware; obtain an appropriate scientific review.
The arXiv submission overview requires a topical, refereeable scientific contribution and author preparation/verification. Registration, possible endorsement, moderation and a distribution licence apply. The supplied technical booklet is a research package, not an already accepted or submitted paper.
38Reproduction and artifact map
Start with output/p22-prototype.html. It contains the interactive CAD and trajectory review. Exact CAD masters are in cad/; the original full plan remains at ../../cryopulse-expanded-plan/plan.json in the workspace and is copied into the package.
Run scripts/static_cold_bench.py, ground_module.py, cold_grip.py, nitrogen_cascade.py, freezing_cycle.py, magnetic_screen.py and vehicle_study.py in the recorded scientific Python environment. Set MPLCONFIGDIR to a writable temporary directory.
CFD cases retain initial fields, mesh-generation inputs, dictionaries, logs, function-object time series and frozen run scripts. The compact archive omits bulky reconstructed/processor volume fields; the full workspace cases retain them. OpenFOAM v2412 and a compatible MPI build are required for reruns.
The environment requirements and exact package versions are recorded. Geometry is produced with Gmsh; VTK generates STEP-derived view meshes and independent field/clearance audits. Original GPL notices in copied OpenFOAM dictionaries are retained.
The package includes SHA-256 integrity records, blank experimental templates and explicit evidence labels. Images are concepts; CAD, CFD, thermodynamic calculations and measurements are distinct evidence classes.
39Primary sources and related work
| Source | Use | Direct link |
|---|---|---|
| arXiv submission overview | Submission process and scientific scope | https://info.arxiv.org/help/submit/index.html |
| Koenigsegg One:1 technical specifications | 28 m benchmark calibration only | https://www.koenigsegg.com/technical-specifications-one1 |
| CoolProp nitrogen properties | Nitrogen equilibrium EOS and reference literature | https://coolprop.org/fluid_properties/fluids/Nitrogen.html |
| IAPWS melting/sublimation release | Water/ice phase-boundary model and verification point | https://iapws.org/technical-guidance/release/MeltSub |
| NIST DLMF 19.34 | Mutual inductance of coaxial circles | https://dlmf.nist.gov/19.34 |
| MIT inductance and magnetic energy | Circuit field-energy context | https://web.mit.edu/viz/guide/Chapter-11-Inductance%20and%20Magnetic%20Energy.pdf |
| OpenFOAM thermal solver | Solver description; exact retained runtime/source version is recorded locally | https://doc.openfoam.com/2212/tools/processing/solvers/rtm/heat-transfer/buoyantPimpleFoam/ |
| NASA compressible mass flow | Nozzle mass-flow reference | https://www.grc.nasa.gov/www/k-12/airplane/mflchk.html |
| Vehicle 3DOF equations | Planar force/moment model context | https://www.mathworks.com/help/vdynblks/ref/vehiclebody3dof.html |
| Air leakage and seal roughness study | Real contact leakage is more complex than a uniform gap | https://arxiv.org/abs/2108.02063 |
| Existing dual-mode suction/freezing gripper | Related work; no world-first claim is made | https://advanced.onlinelibrary.wiley.com/doi/10.1002/adrr.70170 |
Performance, evidence
and the work ahead.
Could a car brake faster than a Bugatti Chiron?
The P4.4 conditional model calculates a 456.7 m stop from 400 km/h, against the published original Chiron figure of 491 m. It reaches 400 km/h in 30.79 s and completes 0–400–0 in 38.35 s. This selected dry-road model includes added mass and finite precharged electricity. Some adverse cases lose the projected advantage. Physical CryoPulse stopping measurements: 0.
Does the Bugatti comparison use the whole CryoPulse system?
The selected P4.4 driving model couples rolling tyres, suspension, brake hydraulics, a finite battery, powered floor pressure, through-flow machinery, wheel assistance, upper braking outlets and adaptive controls. The heavier nitrogen research option is excluded. The wider twelve-part programme remains unfinished; installed component maps, aerodynamics, full structures and hardware still require qualification.
How could powered suction reduce stopping distance?
A powered fan can reduce pressure beneath a sealed footprint, adding normal load at the tyres. Whether that improves braking depends on the actual tyre load response, usable brake torque, heat limits, seal leakage, fan performance and control. Extra hardware also adds mass and consumes energy.
Do the wheels turn out during the high-speed comparison?
No. The compared vehicle keeps its tyres rolling and steering. Outward wheel reconfiguration is a separate supported stationary concept. Forced deployment cases that lose stability are retained as failures rather than counted as improvements.
Does cooling create a continuous supply of new energy?
Cooling can create a pressure deficit in a finite gas volume. Useful force and work require a complete heat, cold, leakage and reset-energy balance. This revision does not establish a continuous supply of new energy or a self-recharging vehicle.
Has a CryoPulse vehicle been built or road tested?
No physical CryoPulse vehicle or measured performance test is represented. The P4.4 material includes dimensional layout CAD, a conditional driving model and a separate CF-1.1 copper-channel bench design. Forty-six road, actuator, plant and battery cases pass their stated computational completion/control gates. This does not establish a failure probability, a safe vehicle or a measured performance advantage.
Could the airflow architecture also increase speed?
The P4.4 same-fitted-engine scalar power balance gives 424.8 km/h engine-propulsion equilibrium. A separate policy that reserves the battery during a slower launch gives a temporary assisted peak of 458.8 km/h. This peak cannot be paired with the fastest sprint. Drag, installed machinery, engine extrapolation, gearing, tyres, cooling and stability remain unqualified. It does not exceed the Bugatti Super Sport 300+ record of 490.484 km/h.
Can CryoPulse accelerate faster with the same engine?
P4.4 calculates 2.08 s to 100 km/h and 30.79 s to 400 km/h using the same fitted effective engine curve, with additional finite electrical assistance. It is slower than the published original Chiron over 0–200 and 0–300 km/h. The current build counts its mass and electrical costs and takes no cold-module performance credit. These are conditional numerical targets.
Is the CryoPulse system complete?
No. This is an unfinished twelve-part research programme. Layout CAD, numerical studies and experimental specifications are available; physical measurements remain at zero. Further theoretical testing, revised-geometry flow studies, component testing and whole-vehicle integration are still to come.
Which added systems are included in the current model?
P4.4 includes finite powered floor pressure, early rear-airflow assistance, finite electrical wheel assistance, directional upper-vent braking, delayed-sensor braking/yaw control and wheel-energy recovery. Startup, rotor inertia, cavity mass, added hardware, electrical losses and carried stores are counted. The separate cold-flow experiment and nitrogen research option do not improve this driving score.
What is the proposed CryoPulse top speed?
The P4.4 scalar continuation projects a temporary assisted peak of 458.8 km/h in a separate reserve-battery policy. That event takes 52.22 s to reach 400 km/h; it cannot be combined with the separate 30.79 s fastest sprint. Keeping the fast sprint gives 424.8 km/h engine-propulsion equilibrium or 448.5 km/h using the remaining store. These are unqualified calculations, with zero physical speed measurements.
THE COLD-FLOW DEMONSTRATOR
Put the idea
on a bench.
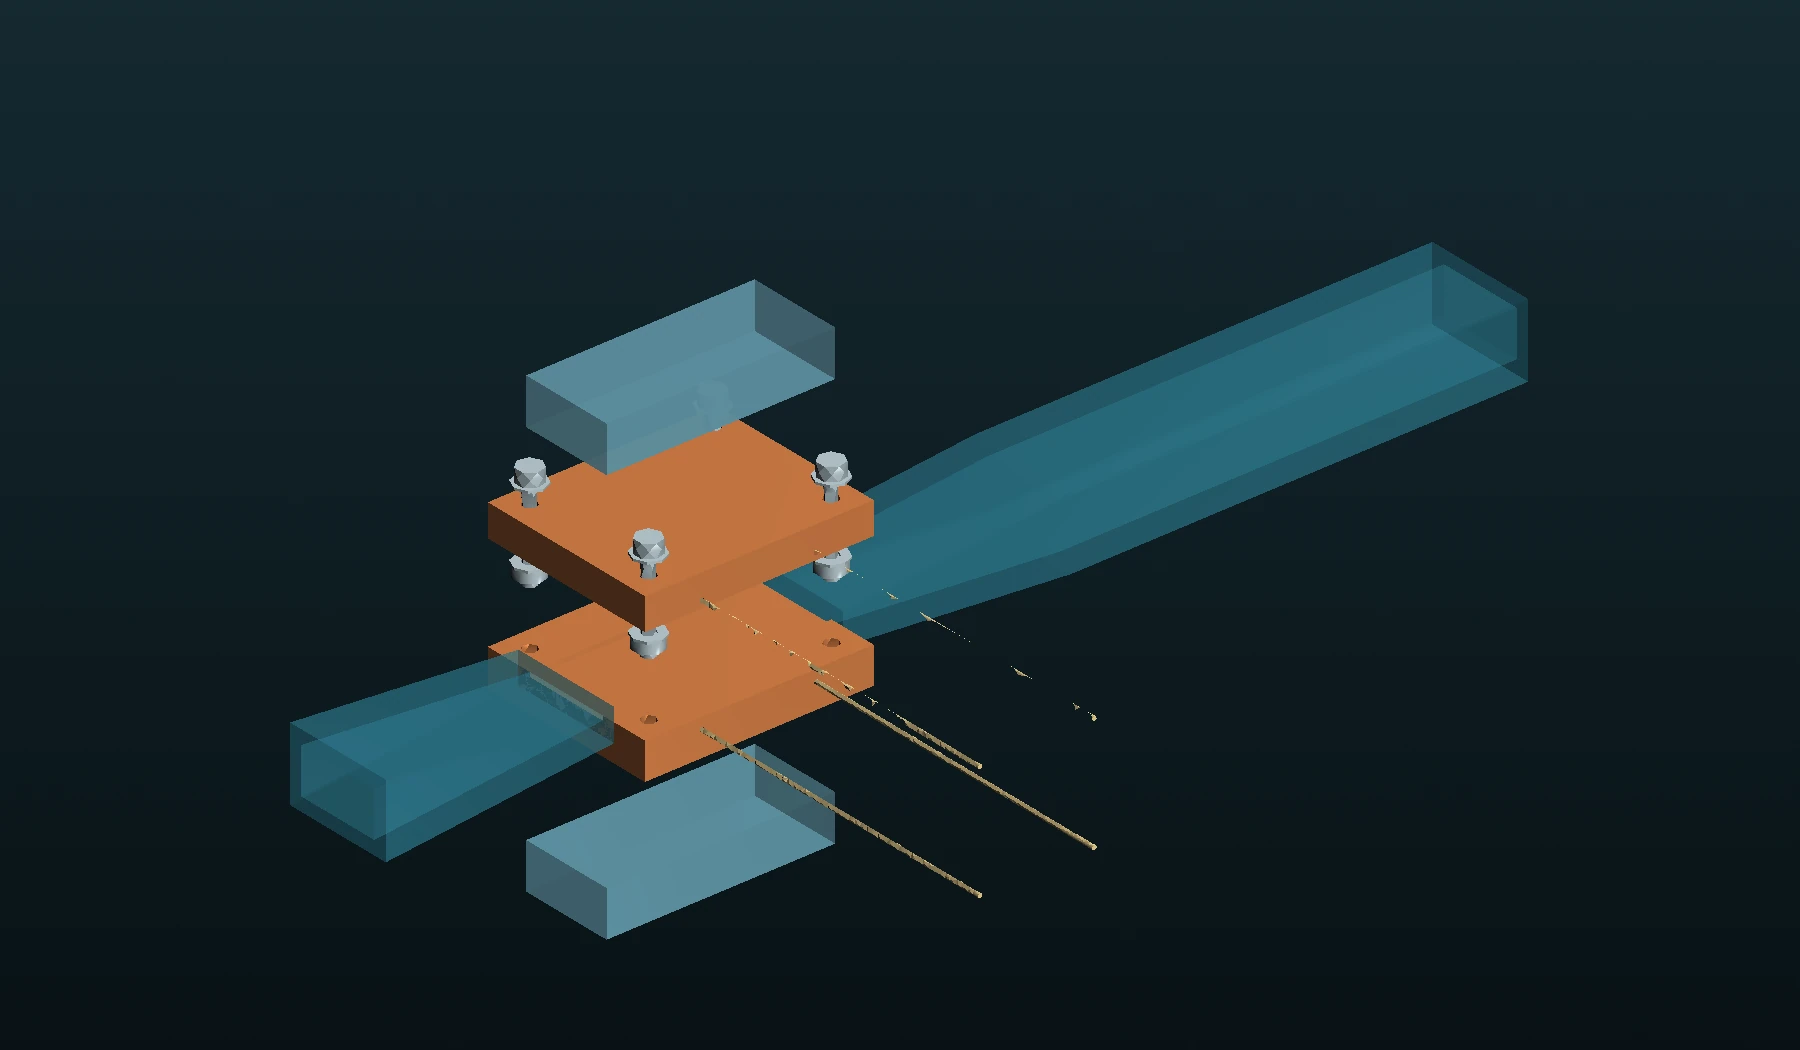
A one-millimetre copper channel. Warm and cold runs at the same pressure. Real CAD, a fixed twelve-pair test plan and analysis that accounts for instrument uncertainty.
This tests one part of CryoPulse: how cooling changes airflow. The blower, cooling system and their electrical inputs are measured separately.
Enter the cold-flow lab Inspect the test protocol ↗Dimensioned design. Numerical study under review.
Hardware measurements: 0.
Previous frozen releases: P4.3 archive ↗ · P4.2 archive ↗. Their assumptions and scores belong to those revisions.
Earlier model releases: P3.7 to P4.1
LATEST RESEARCH / P4.1
More useful power.
A shorter stop.
The revised model turns finite cryogenic resources and engine waste heat into useful electrical power. Stronger floor suction, coordinated braking and an uprated electrical path now carry their full added weight through the same launch and stop.
1.98 s
Published Chiron reference: 2.4 s.
Model 0–400 km/h: 26.29 s.
445.5 m
Published Chiron reference: 491 m.
Model 0–400–0: 33.77 s.
43.8 kW
Peak net output after stage auxiliaries.
0.90 MJ net during acceleration.
Conditional theoretical results. Physical measurements: 0. Same fitted engine curve; same 10 MJ chemical and 8 MJ DC exchange limits. Nine road/fault cases and eighteen new control cases pass the computational checks. Aerodynamic, fan, seal, motor and heat-transfer maps remain hardware targets. Separate sprint and high-speed energy policies are explained in the new chapter.
Explore the new power and performance modelPREVIOUS BASELINE / P4.0
The added systems.
Recalculated.
Active camber, hydraulic motion, cold-system preparation and finite resources now share the vehicle calculation. The updated model carries 125 kg of added systems through one continuous launch and stop.
2.06 s
Conditional launch calculation.
0–400 km/h: 28.53 s.
463.9 m
Published Chiron reference: 491 m.
Model 0–400–0: 36.41 s.
444.7 / 451.7 km/h
Engine-only power equilibrium / temporary 1 MJ boost peak. The top-speed continuation carries the stores left after the launch.
Conditional theoretical results. Physical measurements: 0. The earlier aerodynamic, tyre, fan, pack and brake requirements are retained. New-body CFD is a separate qualification; no new material or camber grip bonus is assigned. The older figures below remain historical references.
Explore the coupled prototypeVEHICLE REFERENCE / P3.7
The reference run.
Before the latest additions.
These P3.7 figures have not been recalculated with the P3.8/P3.9 body revisions, active-camber hardware, proposed tyre changes or cold-cycle integration.
The same wheel speeds, suspension and finite battery carry from launch into braking. The selected calculation targets 1.99 s to 100 km/h, reaches 400 km/h in 27.24 s, then stops in 448.4 m.
34.88 s complete 0–400–0 event22.2% shorter modelled dry stop96 sampled model checks
The identical-start braking control gives 576.6 m with air systems off. A shared tyre law, cell voltage, charging limits and heat are now included. The model carries a 2,587 kg mass target.
Conditional numerical results. Physical measurements: 0. Tyres, fans, seals and aerodynamic targets remain unmeasured. The P4.1 model above recalculates the added systems with finite resources. Its component and aerodynamic targets remain unmeasured. Earlier screens below retain their original assumptions and figures.
Explore the complete P3.7 event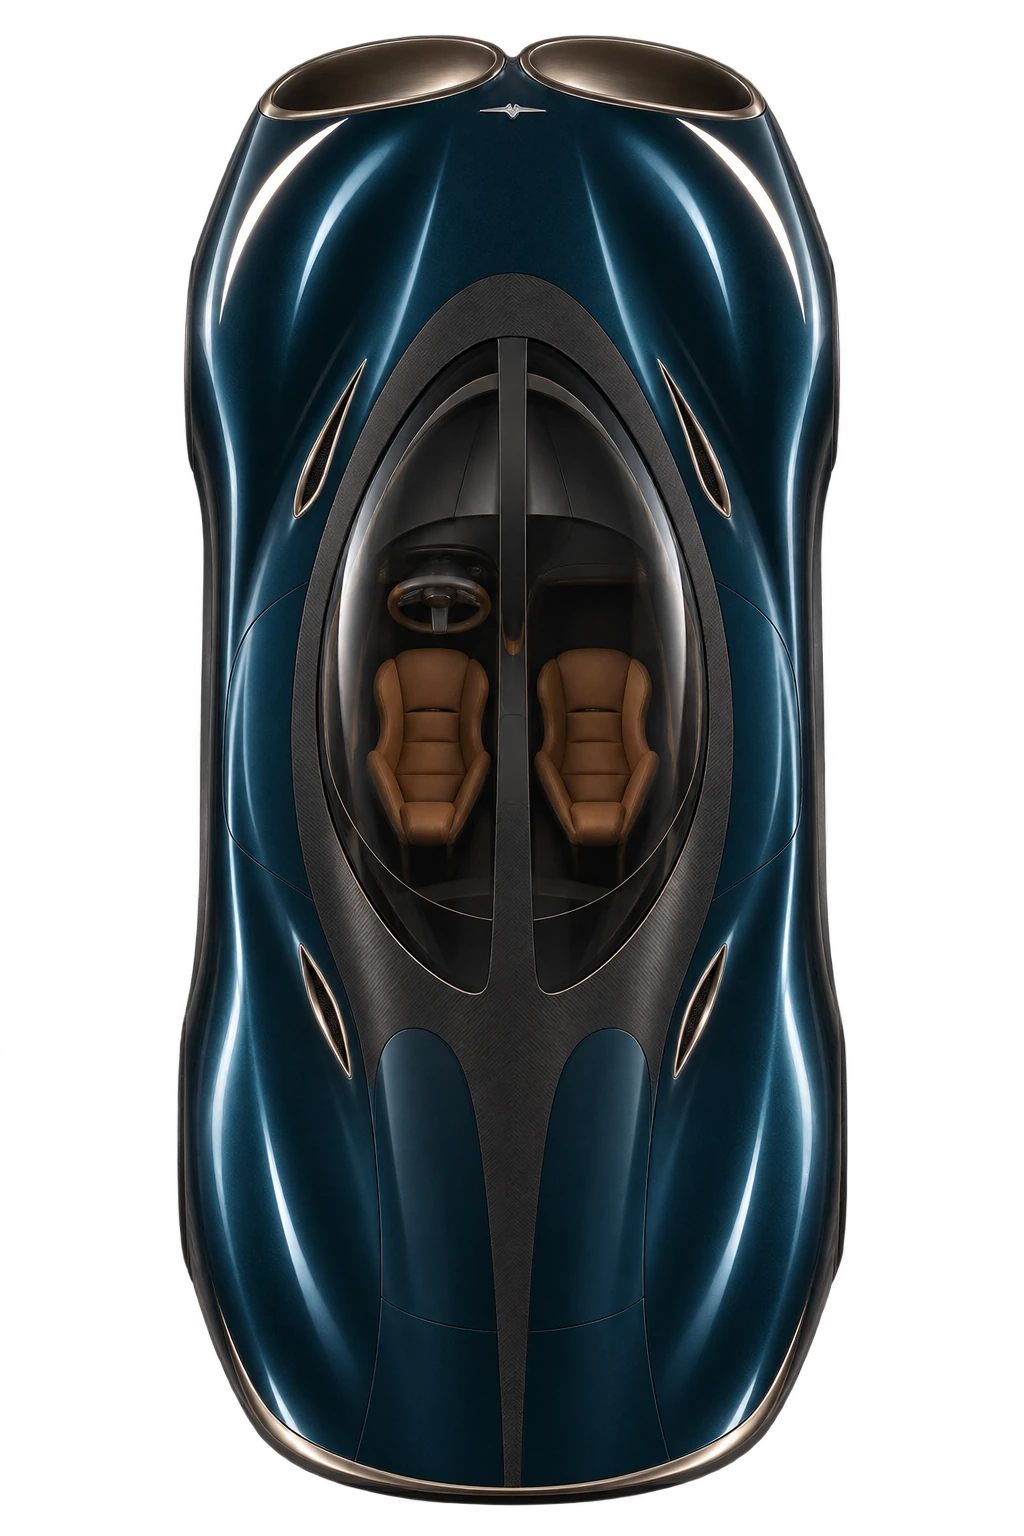
Launch · upward braking routes · powered floor · one finite pack
NEXT SYSTEM STUDIES / P3.8
Make the whole car work.
The next revision rebuilds the passage around the wheels, checks the airflow over physical time and explores cold pressure and heat recovery. New component gains must enter the complete vehicle model with their mass and energy costs.
Enclosed. Rerouted.
Rear static tyre clearance rises from 0.34 to about 50 mm. All 12 sampled passage spans stay enclosed and connected.
Compress cold. Expand warm.
A shared shaft improves the selected steady net output from 5.9 to 14.9 kJ. Recuperation and metered air target 18.2 kJ with 71% less cooling nitrogen.
Reheat. Expand again.
A separate finite-resource study calculates 21.6% more steady net DC with two-stage reheated expansion.
Theoretical component studies. Startup, installed hardware and performance remain unqualified. These results do not change the audited P3.7 driving figures. Physical measurements: 0.
Explore the wider CryoPulse systemCHASSIS & AIRFLOW / P3.9
Grip is geometry.
The next mechanism gives wheel tilt a controlled path. Wider wheelhouses and an inward duct route make room for that movement. The braking study also tests how forward and upward exhaust share the work.
26.2 mm of adjustment.
A front-projection mechanism covers −4° to +1° of camber across ±85 mm of wheel travel. Tyre-force testing comes next.
96 poses. 19.4 mm clear.
The revised rigid wheel poses clear the body. All 12 sampled passage spans remain enclosed and connected.
Reverse thrust, tested.
The existing vents already combine reverse thrust and downforce. A 26-run angle sweep shows why the balance matters more than simply pointing every jet forward.
Design calculations and sampled CAD checks. No new active-camber grip or whole-car performance gain is assigned. The published P3.7 vehicle benchmark stays frozen. Physical measurements: 0.
Explore wheel geometry & reverse thrustEarlier layouts, comparisons and airflow studies
EARLIER STUDY / P3.2
Earlier projections.
Original assumptions.
These figures belong to the earlier P3.2 model. They exclude the later vehicle, body and active-camber revisions. They remain here as a record of that study; they are not performance figures for the latest CryoPulse design.
Historical model figures.
The 428 m stopping result and 447/457 km/h speed projections below have not been confirmed for the added hardware and revised body. The latest P4.1 coupled calculation appears above. The revised body still needs a qualified aerodynamic force map.
Chiron published: 2.4 s
Conditional CryoPulse target
Chiron published: 491 m
Conditional CryoPulse target
With the same fitted engine output
Aerodynamic equilibrium model
Finite 200 kW / 1 MJ pulse
Temporary peak after engine-only equilibrium
P3.2 assumptions only. Physical measurements: 0.
This earlier target case assumes 230 kg of added system mass, a 0.15 m² external drag-area improvement, powered suction, upward braking ducts and sufficient tyre/brake capacity. The boost-on acceleration case adds a precharged 200 kW traction pulse. These are design targets awaiting validation; later additions are not included.
Acceleration and braking
| Metric | Chiron Published | CryoPulse Traction boost off | CryoPulse 200 kW pulse on |
|---|---|---|---|
| 0–100 km/h | 2.4 s | 2.1 s | 2.0 s |
| 0–200 km/h | 6.1 s | 6.1 s | 5.1 s |
| 0–300 km/h | 13.1 s | 13.9 s | 12.5 s |
| 0–400 km/h | 32.6 s | 32.4 s | 30.9 s |
| 400–0 stopping distance | 491 m | 428 m | 428 m |
| 0–400–0 km/h | 41.96 s | 40.7 s* | 39.2 s |
The propulsion-engine power envelope stays the same. Launch suction uses the auxiliary electrical store in both CryoPulse modes. Boost-off does not improve every acceleration interval. *Boost-off combined time is the sum of the separately calculated acceleration and braking phases; the boost-on 39.2 s case explicitly carries its stores through both phases without reset.
Validation limit: the held-out 400 km/h reference prediction was about 7.9% quicker than the published time. The final reference curve is calibrated to the benchmark; the projected advantage remains a design target.
THE FULL-VEHICLE LAYOUT CAD
Open the doors.
Explore the upward air ducts.
Inspect the actual CAD-derived layout. The revised passages clear the upper entry region, while four connected upward outlets develop the braking branch. These are unbuilt packaging models; the valve, flush covers, structural and human-access work are still in development.
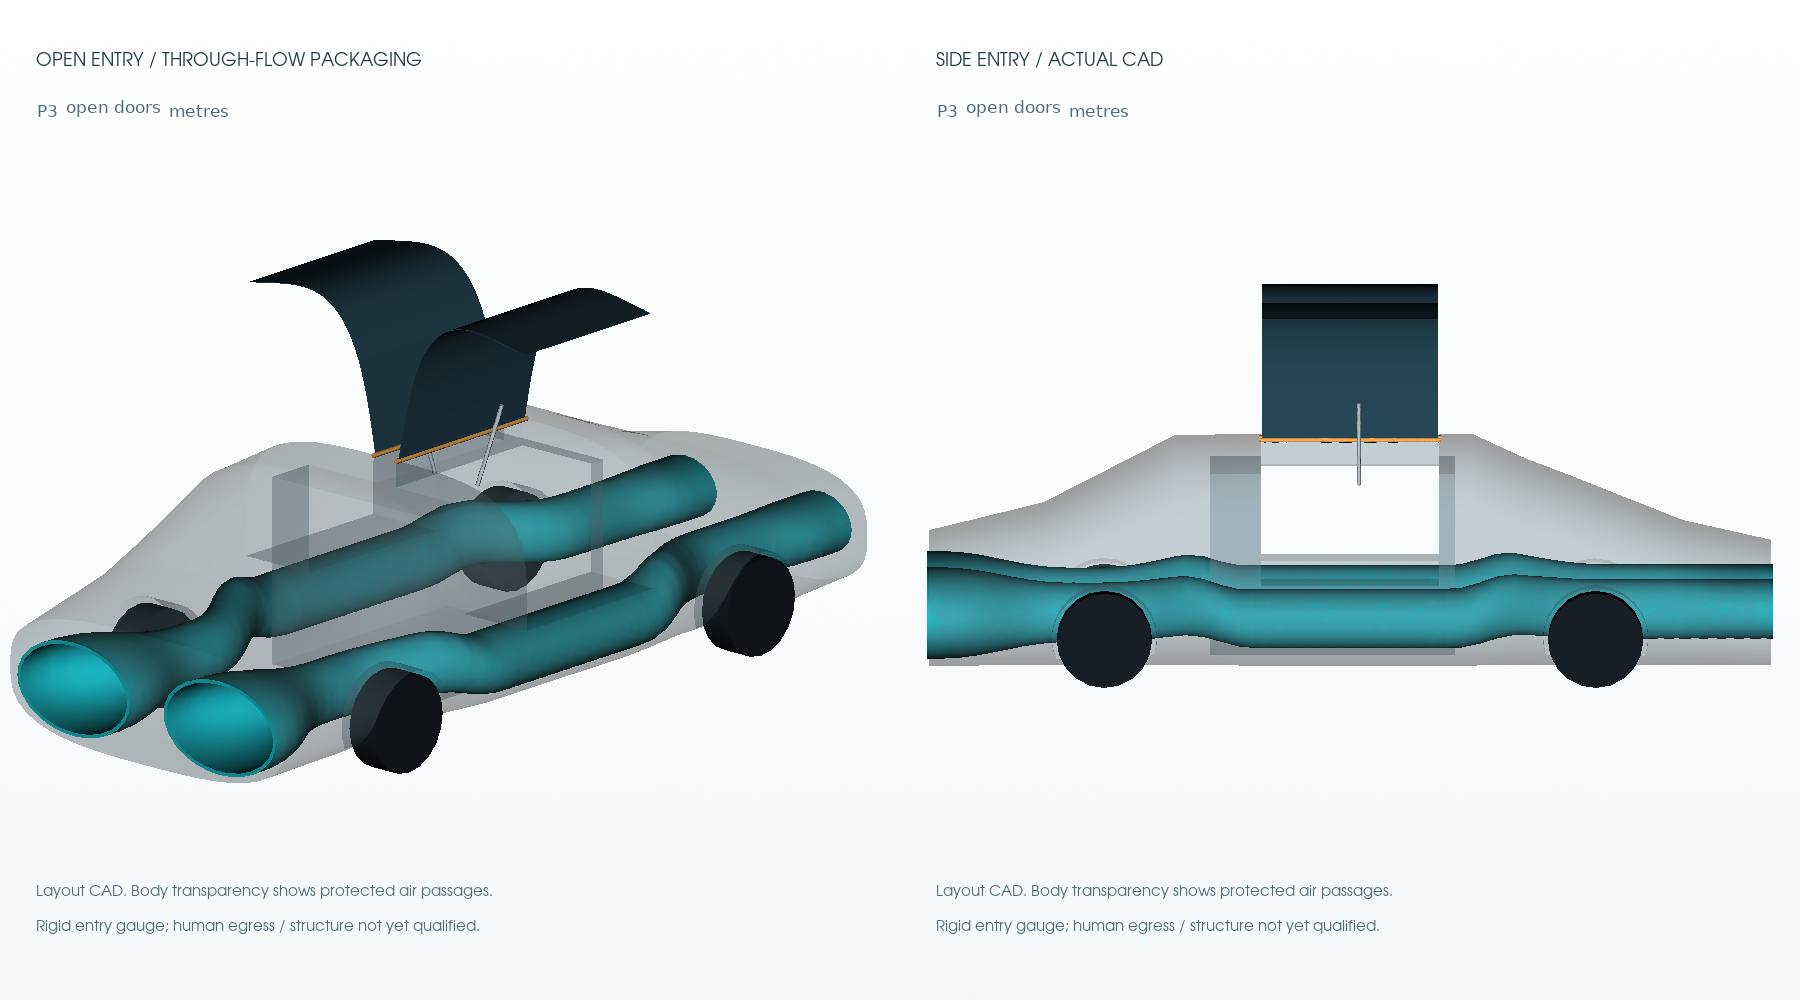
Opening-door layout
Curved panels, a specified hinge path and a linkage-load screen. The 600 mm sill and real human ingress still need a full-scale mock-up.
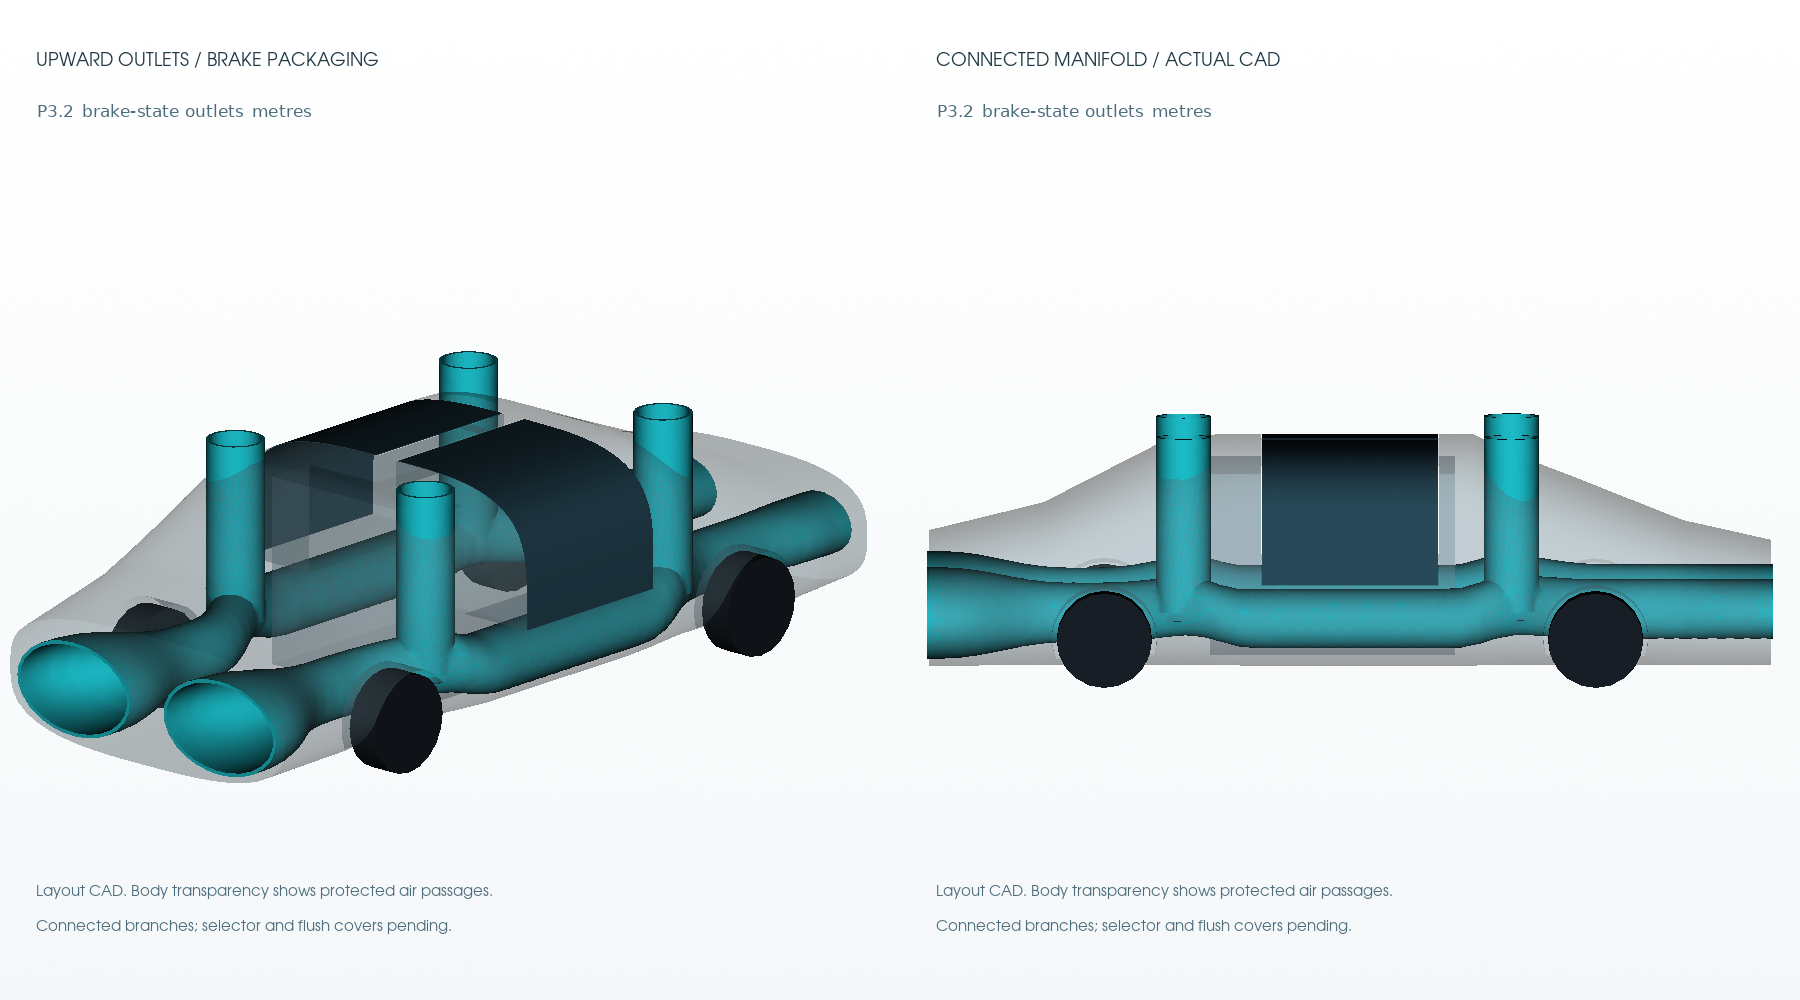
Four upward braking outlets
The same intake stream is redirected upward in braking to create downward reaction and drag. Branch balance and installed losses need further testing.
THIS IS STILL ONLY THE BEGINNING
A bigger system.
An unfinished programme.
The work now covers airflow, launch support, braking, finite energy stores, cryogenic routing, a freezing-pressure accumulator and cooperative magnetic studies. The twelve-part plan is not complete, and no whole-vehicle performance is proven.
Next: resolve the revised-geometry flow evidence, build the bench demonstrations, replace assumed component maps with measurements and extend the integrated driving task. Further theoretical testing and physical demonstrations are to come.
Download this P3.2.1 layout and source ↗P3.3 / THE SHARED-RESOURCE MODEL
One car.
One connected system.
The next model brings rear airflow, upper vents, electrical power, storage mass and heat into the same research programme. Explore the findings here, then inspect the complete web study.
REAR AIR / UPPER VENTS
Give each mode
its own purpose.
Powered rear airflow raises the separate speed-event prediction from 446.5 to 449.4 km/h with a reserved 1 MJ pulse. The upper outlets trade forward momentum for downward reaction.
That makes valve position, rotor loading and power allocation part of the acceleration and braking question.
Outlet styling proposal. The actual bench selector CAD is in the study.LONGER PULSE / HARDWARE INCLUDED
More usable energy.
Carry the mass.
24.0s0–400 km/h
447m400–0 km/h
This separate case uses an 8 MJ DC window, up to 200 kW extra wheel power and a 2424 kg vehicle. The pack screen adds about 199 kg to the earlier mass allowance.
Conditional model. Same fitted combustion engine; additional stored electrical energy. The high-speed shape and hardware targets still require validation.
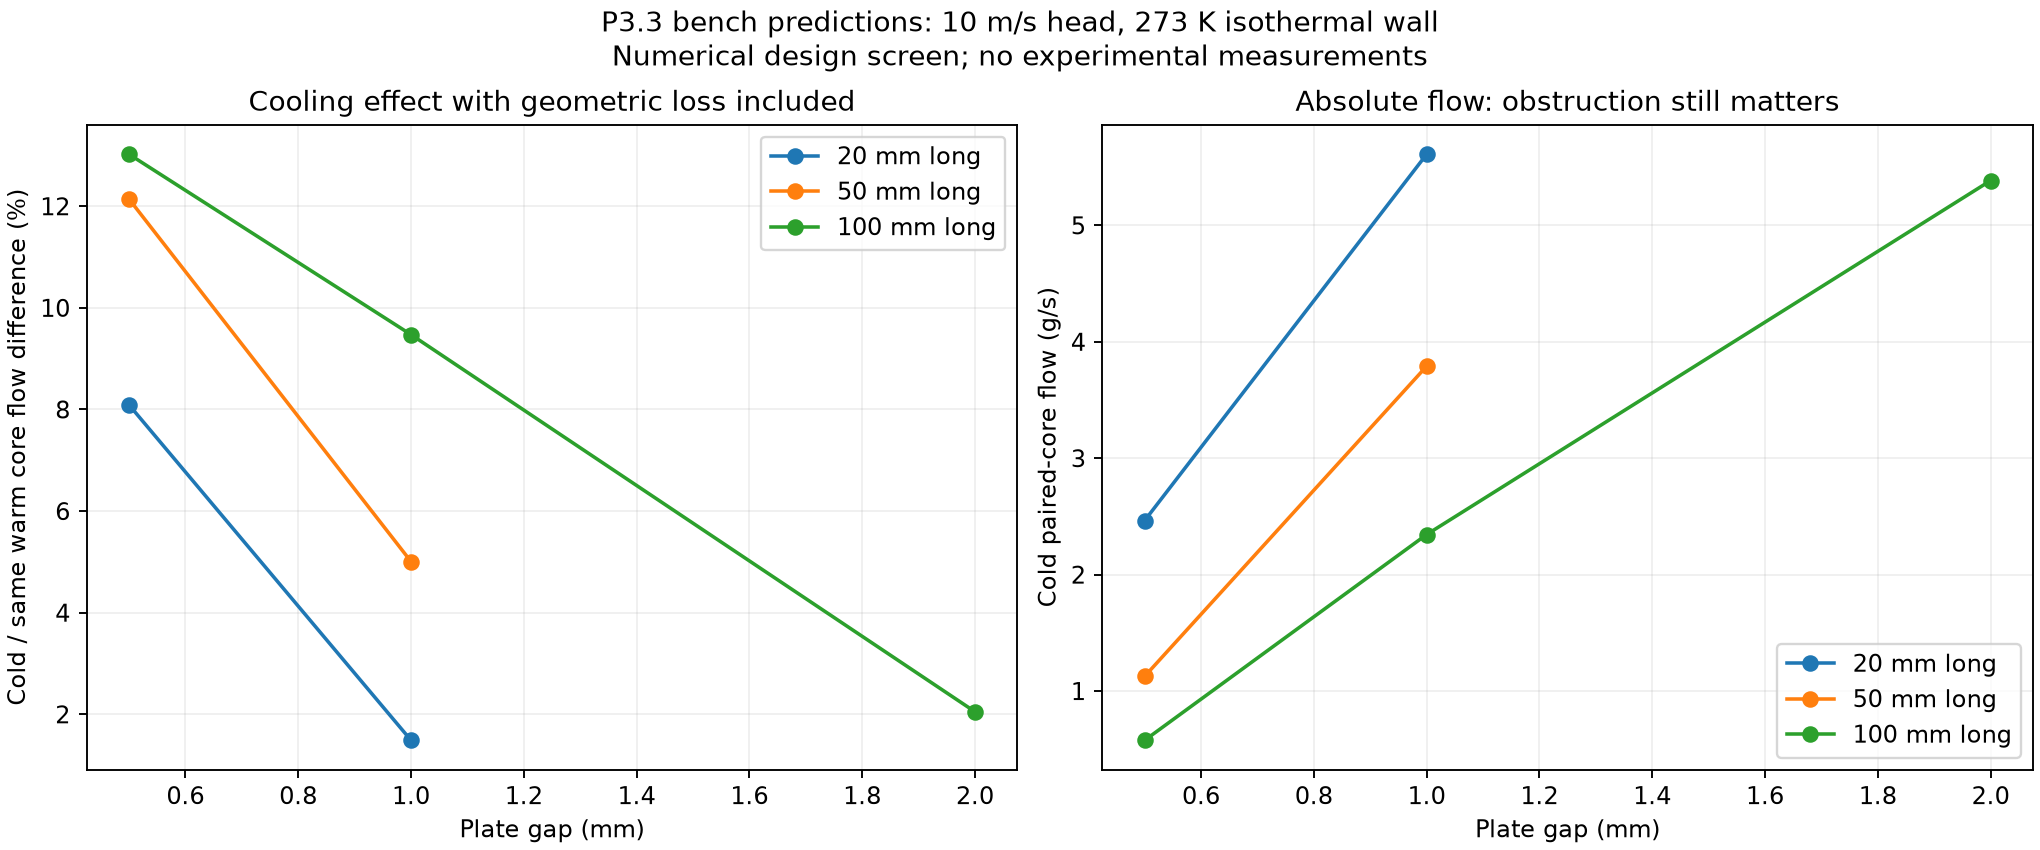
A FALSIFIABLE COLD-FLOW TEST
Measure the flow.
Account for the cold.
5.0%predicted matched-core flow gain
The selected 1 mm slot model predicts about 3.79 g/s at matched head, with 64 W drawn from the cold bath. The bypass carries more absolute flow, so the restriction cost is measured too.
Dry-air bench prediction with isothermal walls. The instrumented ice-water experiment is designed; hardware measurements are still to come.
AN OPEN RESEARCH RECORD
The results.
And what they establish.
5new CFD runs completed
26coupled configurations audited
Conservation, finite-store accounting, sampled motion and CAD scale checks pass. The new flow comparisons retain unresolved convergence and mesh limits.
Physical measurements: 0. The low-speed drag trend is preliminary and does not validate the high-speed aerodynamic target.
Rear and upper outlets share one intake stream. Wheel torque and powered airflow share a finite pulse budget. The programme remains unfinished.
Explore the full P3.3 web studyNEW / P3.5 VISUAL PROTOTYPE
The whole car.
Now in motion.
Replay four-wheel braking, upper-vent forces and finite energy together. The dry matched-mass model stops in 441.8 m with air systems on, versus 543.3 m off. Explore nine driving conditions, a cold-pressure demonstration and rotatable bench CAD.
Conditional numerical results. Both virtual controllers meet the nine stated lane and heading tests. Hardware targets still need measurement; physical measurements: 0.
Explore the moving modelP3.4 / DIRECTIONAL BRAKING
Upper vents. Axle loads. Shared power.
The next matched model gives 429.4 m versus 451.6 m from 400 km/h with powered vectoring. It adds front/rear load balance, outlet-pressure sensitivity, a protected power supply and three bench outlet designs.
Conditional component-coupled model at 2449 kg, including a 25 kg new-hardware allowance. Unvalidated installed flow and hardware targets; physical measurements: 0.
Sources and reproduction
Full review dataVehicle resultsHigh-speed resultsThermal CFD auditAirflow CFD auditBlank experiment recordEarlier thermal modelOriginal 12-part plan
- arXiv submission overviewSubmission process and scientific scope
- Koenigsegg One:1 technical specifications28 m benchmark calibration only
- CoolProp nitrogen propertiesNitrogen equilibrium EOS and reference literature
- IAPWS melting/sublimation releaseWater/ice phase-boundary model and verification point
- NIST DLMF 19.34Mutual inductance of coaxial circles
- MIT inductance and magnetic energyCircuit field-energy context
- OpenFOAM thermal solverSolver description; exact retained runtime/source version is recorded locally
- NASA compressible mass flowNozzle mass-flow reference
- Vehicle 3DOF equationsPlanar force/moment model context
- Air leakage and seal roughness studyReal contact leakage is more complex than a uniform gap
- Existing dual-mode suction/freezing gripperRelated work; no world-first claim is made
The complete hypothesis and research remain readable. Interactive simulations require JavaScript; the PDF and CAD downloads provide static alternatives.